This was the most profitable strategy despite winning on less than one-third of trades. The biggest winner here was a July/December call calendar spread entered in MRUS on June 6th and exited on September 29th for a 392% gain.
The lowest win rate of any strategy I employed. Barely won one out of four. But still profitable because the winners—when they came—more than compensated for the frequent small losses.
Big winners here included a long puts play in SMPL entered on August 15th and exited on October 23rd for a 1,234% gain, and a long calls trade in GDXJ entered on July 30th and exited September 30% for a 604% gain.
High win rate. Low profitability per dollar risked. These are grind-it-out plays that work most of the time but don't move the needle dramatically.
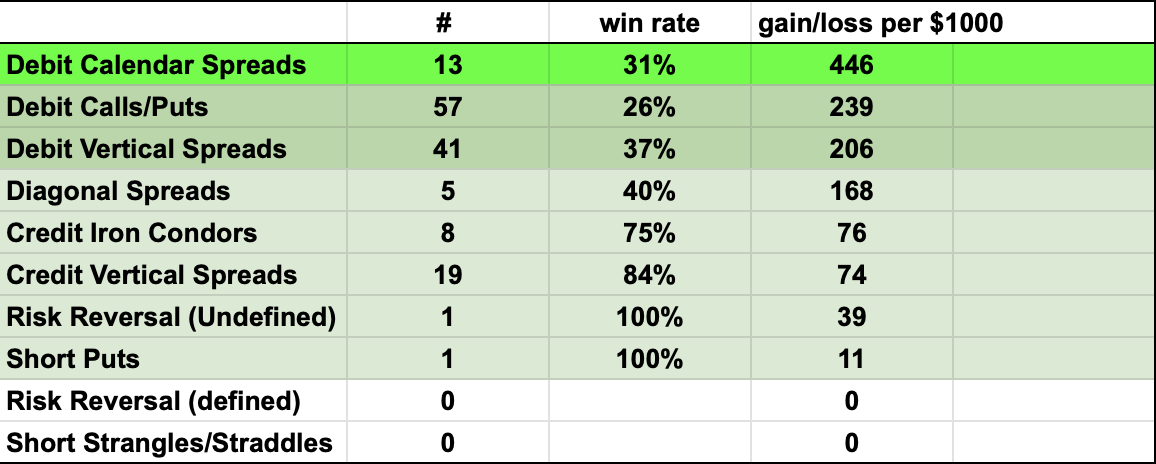
Credit Iron Condors: 8 trades, 75% win rate, $76 profit per $1,000
Similar profile. Win often, win small. Useful for specific market conditions but not the engine of performance.
The Lesson in the Numbers
Notice the inverse relationship: the strategies with the worst win rates delivered the best returns per dollar risked.
Calendar spreads won 31% of the time but generated $446 per $1,000. Credit verticals won 84% of the time but only generated $74 per $1,000.
That's 6x more profit for less than half the win rate.
This is asymmetry in action. This is why we use options.
The Equity Curve Story
Looking at the equity curve (see above), you can see the journey wasn't linear. There were drawdowns. Periods of chop. Moments where nothing was working.
But the overall trajectory? Up and to the right.
Those vertical jumps? That's calendar spreads and long calls and puts hitting. That's SMPL delivering 1,234%. That's what happens when you let winners run and don't cap your upside.
The steadier grind? That's the vertical spreads and credit strategies providing base hits while waiting for the home runs.
What This Actually Means
You don't need a high win rate to make serious money in options. In fact, chasing a high win rate often limits your upside.
Credit strategies feel good because you win often. But they cap your gains. You're collecting premium and hoping to buy it back cheaper. Your max profit is defined from day one.
Debit strategies feel uncomfortable because you lose often. But when they work, there's no ceiling. MRUS going from a $6.80 calendar spread to a nearly 400% winner? That doesn't happen with credit spreads.
The traders who thrive understand this. They're willing to be wrong frequently in exchange for being occasionally, spectacularly right.
The Real Edge
My edge wasn't predicting which trades would be the big winners. It was:
1. Structuring trades with favorable asymmetry
2. Sizing positions appropriately so losses didn't devastate
3. Having the discipline to cut losers when the thesis broke
4. Having the courage to hold winners when they were working
That fourth one is the hardest. Multiple community members mentioned this in their year-end responses—the difficulty of holding through discomfort when gains get large.
But look at the equity curve. Those big jumps came from letting winners run. If I'd taken profits at 50% or 100% on every trade, the year would look completely different.
The Uncomfortable Truth
A 41% win rate means I was wrong more often than I was right. That's psychologically difficult. Every week had losers. Every month had positions that didn't work.
But the 108% return proves the strategy works. Not despite the low win rate—because of the asymmetry it creates.
Would I trade a 70% win rate for a 40% return? Never. I'll take being wrong often if it means being right big when it counts.
What's Coming in 2026
This approach works. The numbers prove it. The equity curve confirms it.
2026 will bring different market conditions. Different volatility regimes. Different opportunities.
But the principles remain: structure trades with asymmetric payoff, manage risk religiously, cut losers quickly, let winners run.
That's the formula. It worked in 2025. It'll work in 2026.
Want to follow along in real-time?All Star Options delivers the same detailed trade plans that generated these results—complete with entry points, profit targets, stop levels, and the reasoning behind every position. Join us and see how asymmetric options strategies actually work in practice.
--> If you'd like to receive these notes in your email, sign up here.
Sean McLaughlin | Chief Options Strategist, All Star Charts