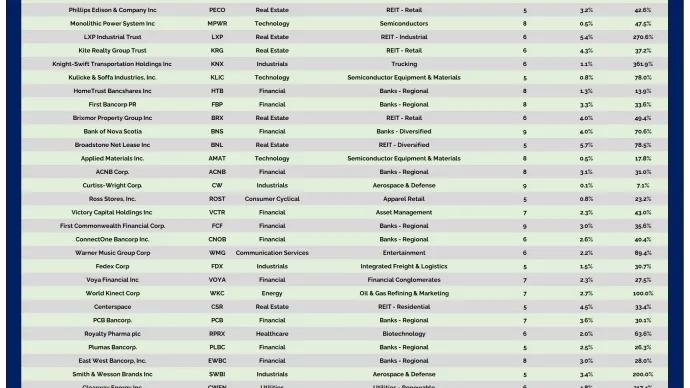
Dividend Aristocrats are easily some of the most desirable investments on Wall Street. These are the names that have increased dividends for at least 25 years, providing steadily...
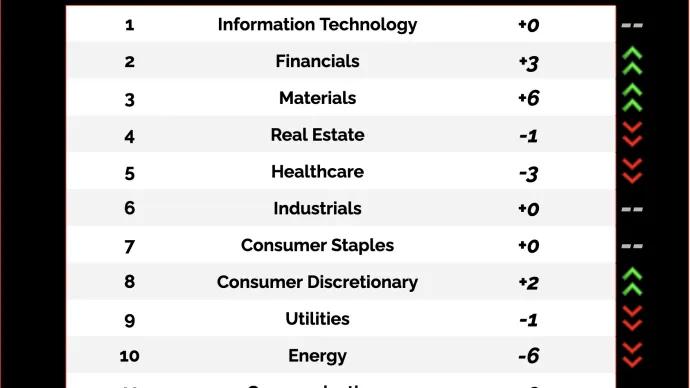
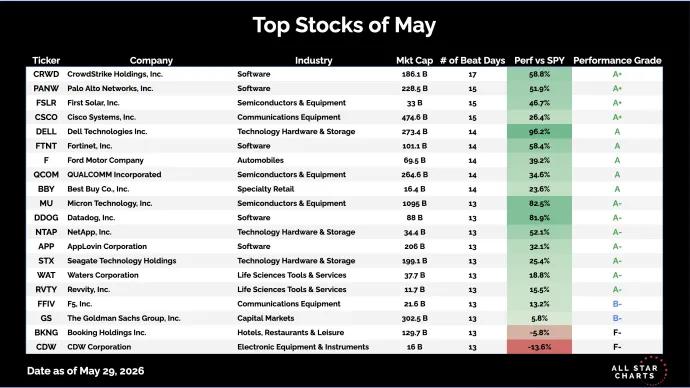
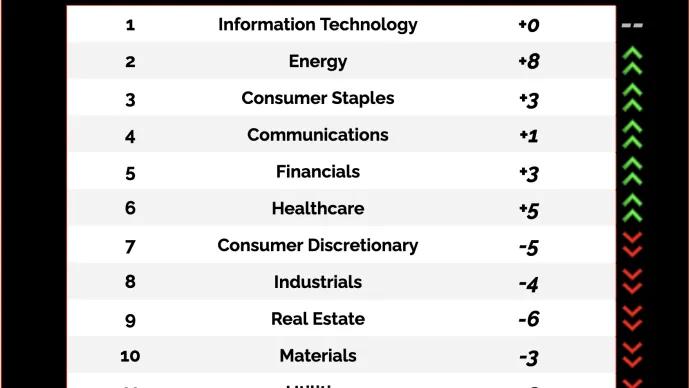
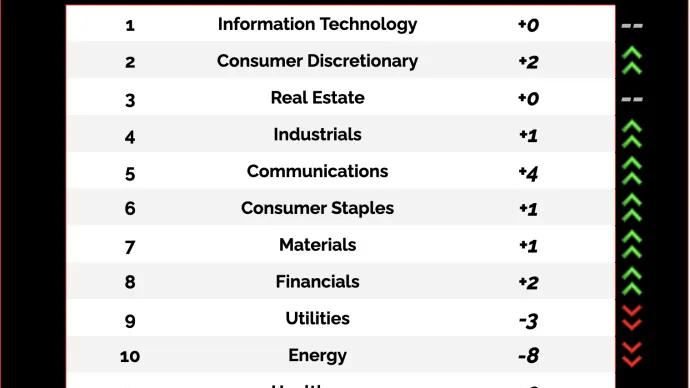
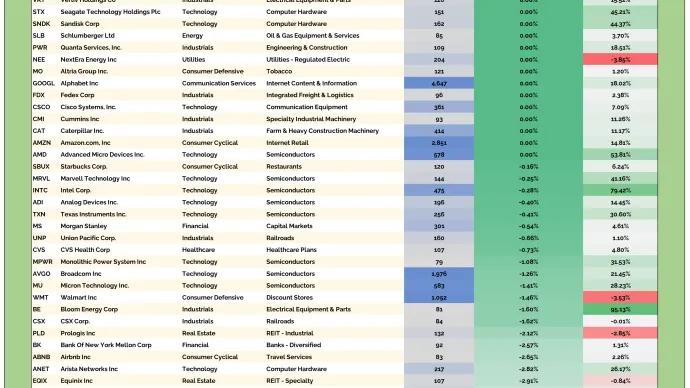
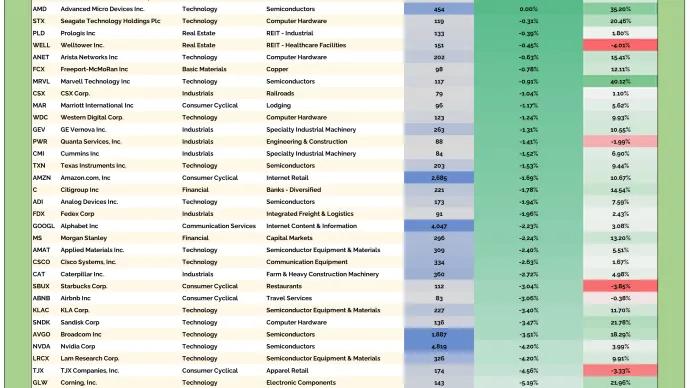
The big theme was a powerful comeback in tech — led by mega-cap names. Semiconductors continued to act as leadership, while software found support and bounced right on cue.
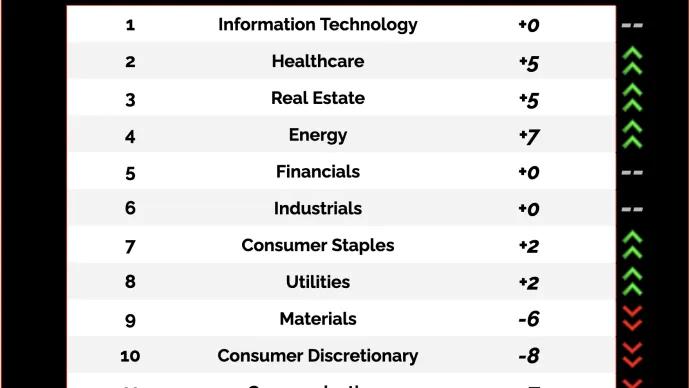
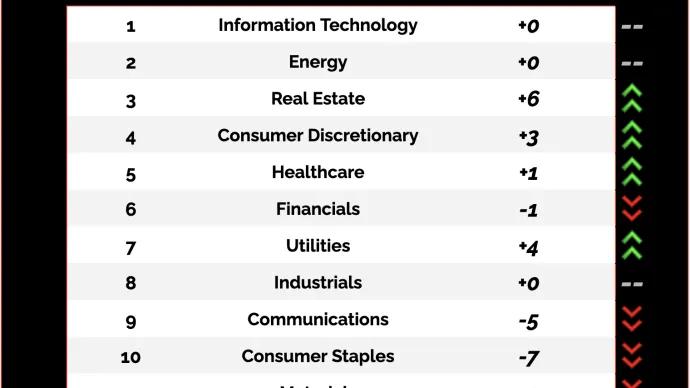
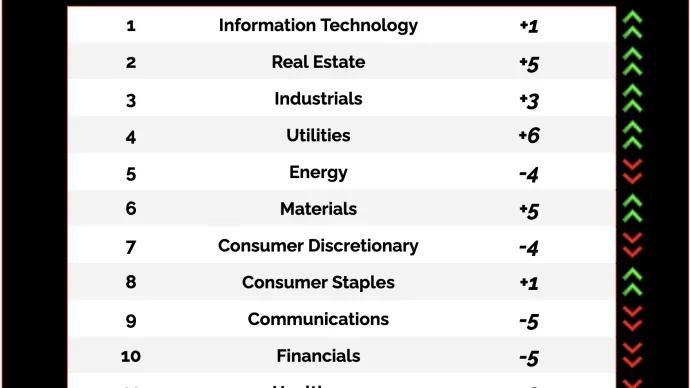
At the same time, the Q1 leaders quietly stepped...
Dividend Aristocrats are easily some of the most desirable investments on Wall Street. These are the names that have increased dividends for at least 25 years, providing steadily...