When it comes to seasonality, the best signals often appear when the market breaks from the script.
That’s when we learn what’s really happening beneath the surface.
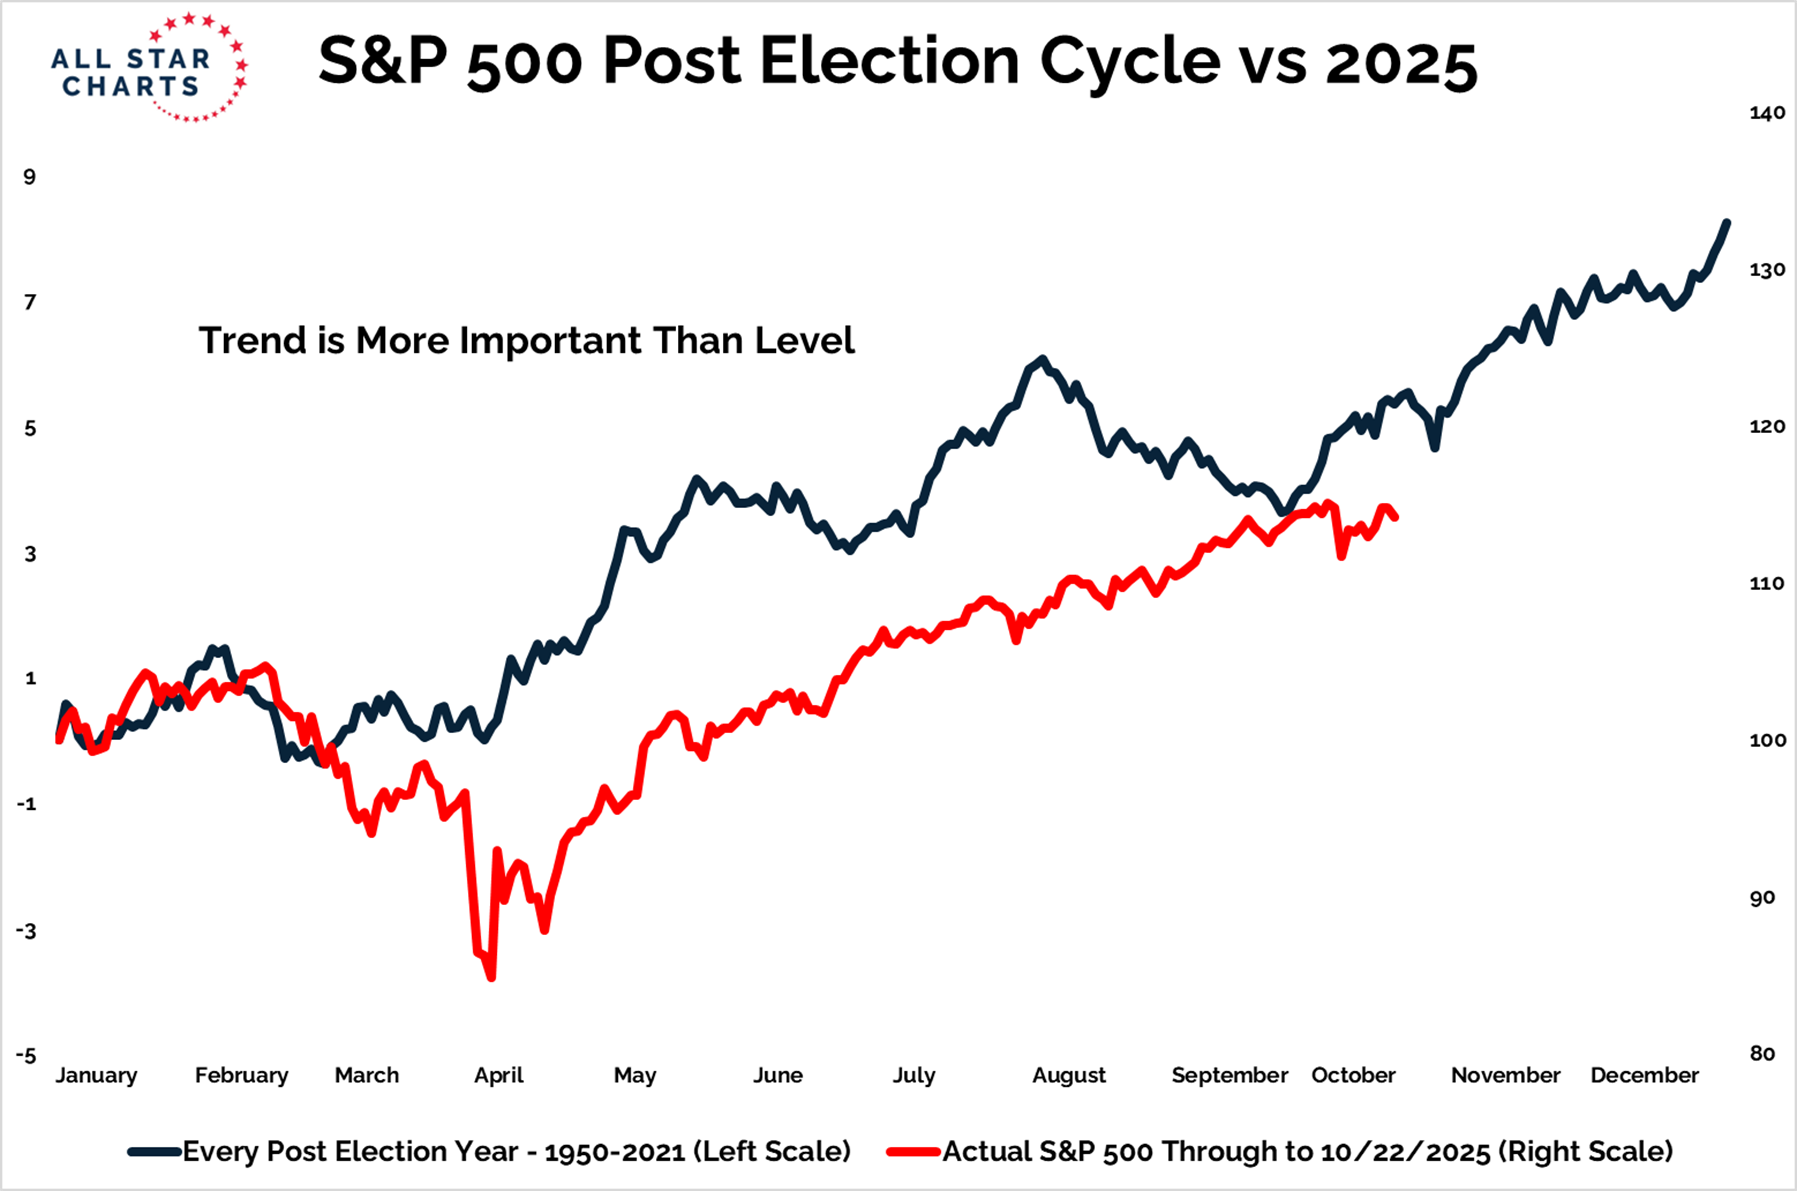
Historically, August through October has been one of the toughest periods for stocks — but this year, the S&P 500 shrugged off the usual seasonal weakness.
The chart below illustrates this, tracking the S&P 500’s post-election year performance from 1950 to 2021 (in blue), compared to 2025 so far (in red).
You can clearly see how this year’s resilience stands out.
When bearish seasonality doesn’t play out, it speaks volumes about the underlying strength of the trend.
If stocks hold firm through the stormiest part of the calendar, just imagine what they could do as we move into the most bullish period of the year.
October has a long history of volatility and “black swan” events — but it’s also known for marking major buying opportunities.
And right now, the market is sitting in that sweet spot for a year end rally.