Last week, we discussed the volatility shock that rocked precious metals. It was rare, violent, and it forced us to respect the damage.
But it’s important to remember the context.
That extreme move didn’t happen in a vacuum. It happened inside a secular bull market that has been in motion since March of 2024.
Trends don’t end because they get extended. They end when there's nobody left to buy.
When leadership deteriorates, offensive rotations break down, and when the market stops rewarding risk.
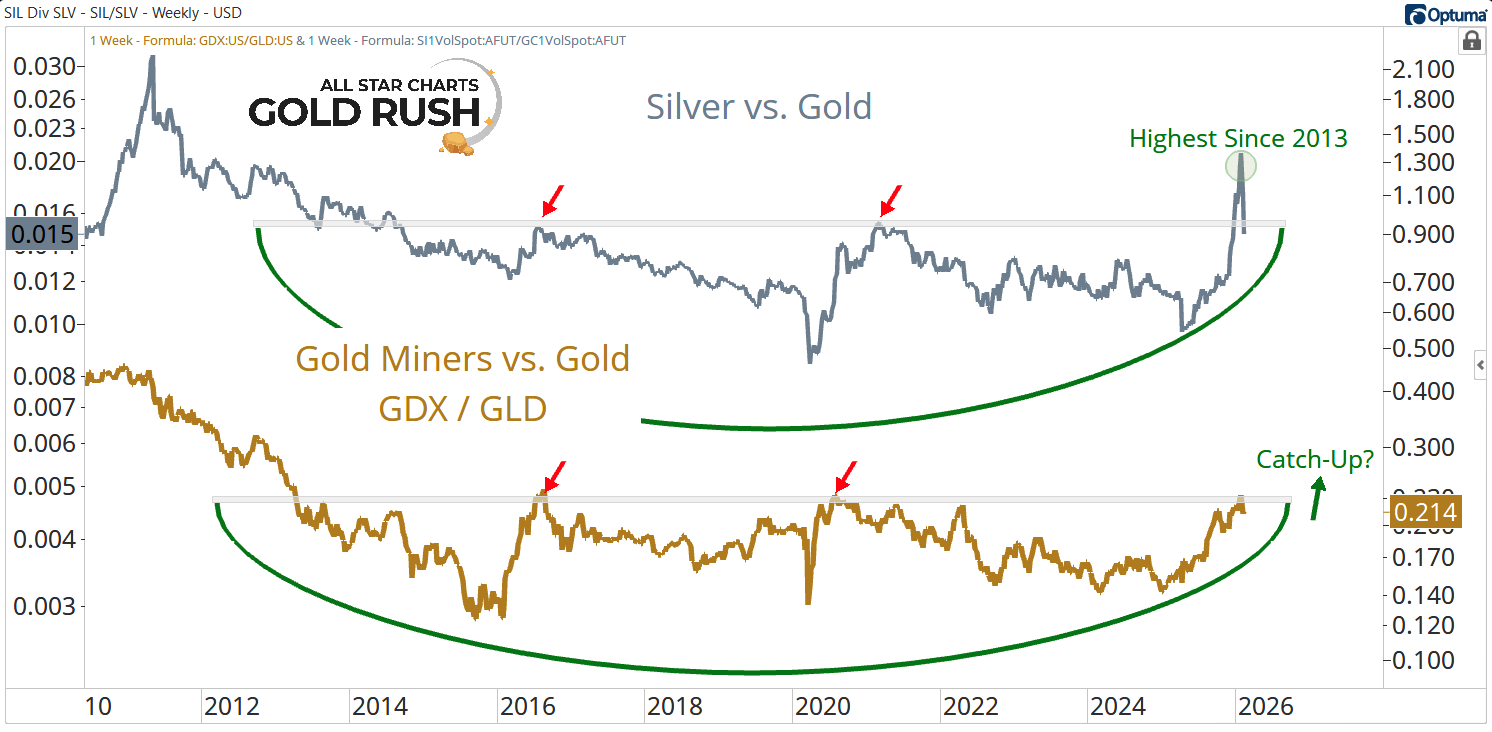
And that brings us to what is arguably the most important chart in precious metals right now.
Silver relative to Gold, overlaid with Gold Miners $GDX relative to Gold $GLD.
These two intermarket ratios have moved in lockstep for years.
When one leads, the other tends to confirm. When one weakens, the other usually follows.
Together, they form a powerful read on risk appetite within the metals complex.
Silver vs. Gold is the offensive metal ratio. When Silver outperforms Gold, it tells us investors are leaning into risk.
GDX / GLD is the offensive equity ratio. When miners outperform the metal itself, it signals expanding participation and aggressive capital rotation.
For most of this bull market, these two have marched together.
Recently, however, something interesting happened.
Silver relative to Gold broke out to its highest level since 2013, but GDX / GLD did not confirm that move.
Instead, the ratio stalled at a key shelf of former highs.
Now Silver vs. Gold has pulled back to retest that breakout level.
This is where the principle of polarity comes into play. Former resistance, once broken, should become support. If this is truly a structural breakout, buyers should defend this level.
If that happens, the message is clear: risk appetite remains intact, and Gold miners likely play catch-up in a powerful way.
That would likely coincide with GDX / GLD resolving higher out of its own base and breaking to new multi-decade highs. This would represent a new phase of this bull market, one led by equities, not just futures.
On the other hand, if Silver relative to Gold slices back below this level, as if it never existed, that tells us something much bigger is unfolding.
Failed moves tend to lead to fast moves in the opposite direction. The precious metal bulls don't want to see that.
That is why this chart matters so much.
Right now, they are sitting at a decision point.
We are not interested in predicting which way they resolve. We are interested in observing and responding.
If Silver holds up relative to Gold and turns higher, we want to lean back into the miners and prepare for a fresh catch-up leg.
If it fails, we stay patient and let the market do the heavy lifting of consolidation.
This is not a time for ego. It’s a time for attention.
Whether this shelf holds or breaks will likely dictate the next major move in precious metals.
Supercycle Report highlights the breakout setups, rotations, and technical signals shaping metals markets — giving traders an edge in gold, silver, and commodities.