Every week, we break down the Commitment of Traders (COT) Report to see how commercial hedgers - the so-called “smart money” in the futures markets - are positioning across asset classes.
This data, published by the CFTC, reveals where producers, processors, and other large institutions with significant exposure to commodities and financial instruments are hedging their risk.
Why do we care? Commercials are typically on the opposite side of trend-chasing speculators. They’re the ones most familiar with the underlying fundamentals of their markets, and when their positioning reaches extremes, it often signals turning points or exhaustion in price trends.
In other words, while commercials aren’t always early, they’re rarely on the wrong side of the big move for long.
By monitoring how their positioning stacks up relative to history - whether they’re holding their largest net-long or net-short positions in years - we gain a valuable contrarian perspective.
These signals don’t always translate into immediate price reversals, but they consistently offer critical context for understanding where we are in the broader cycle.
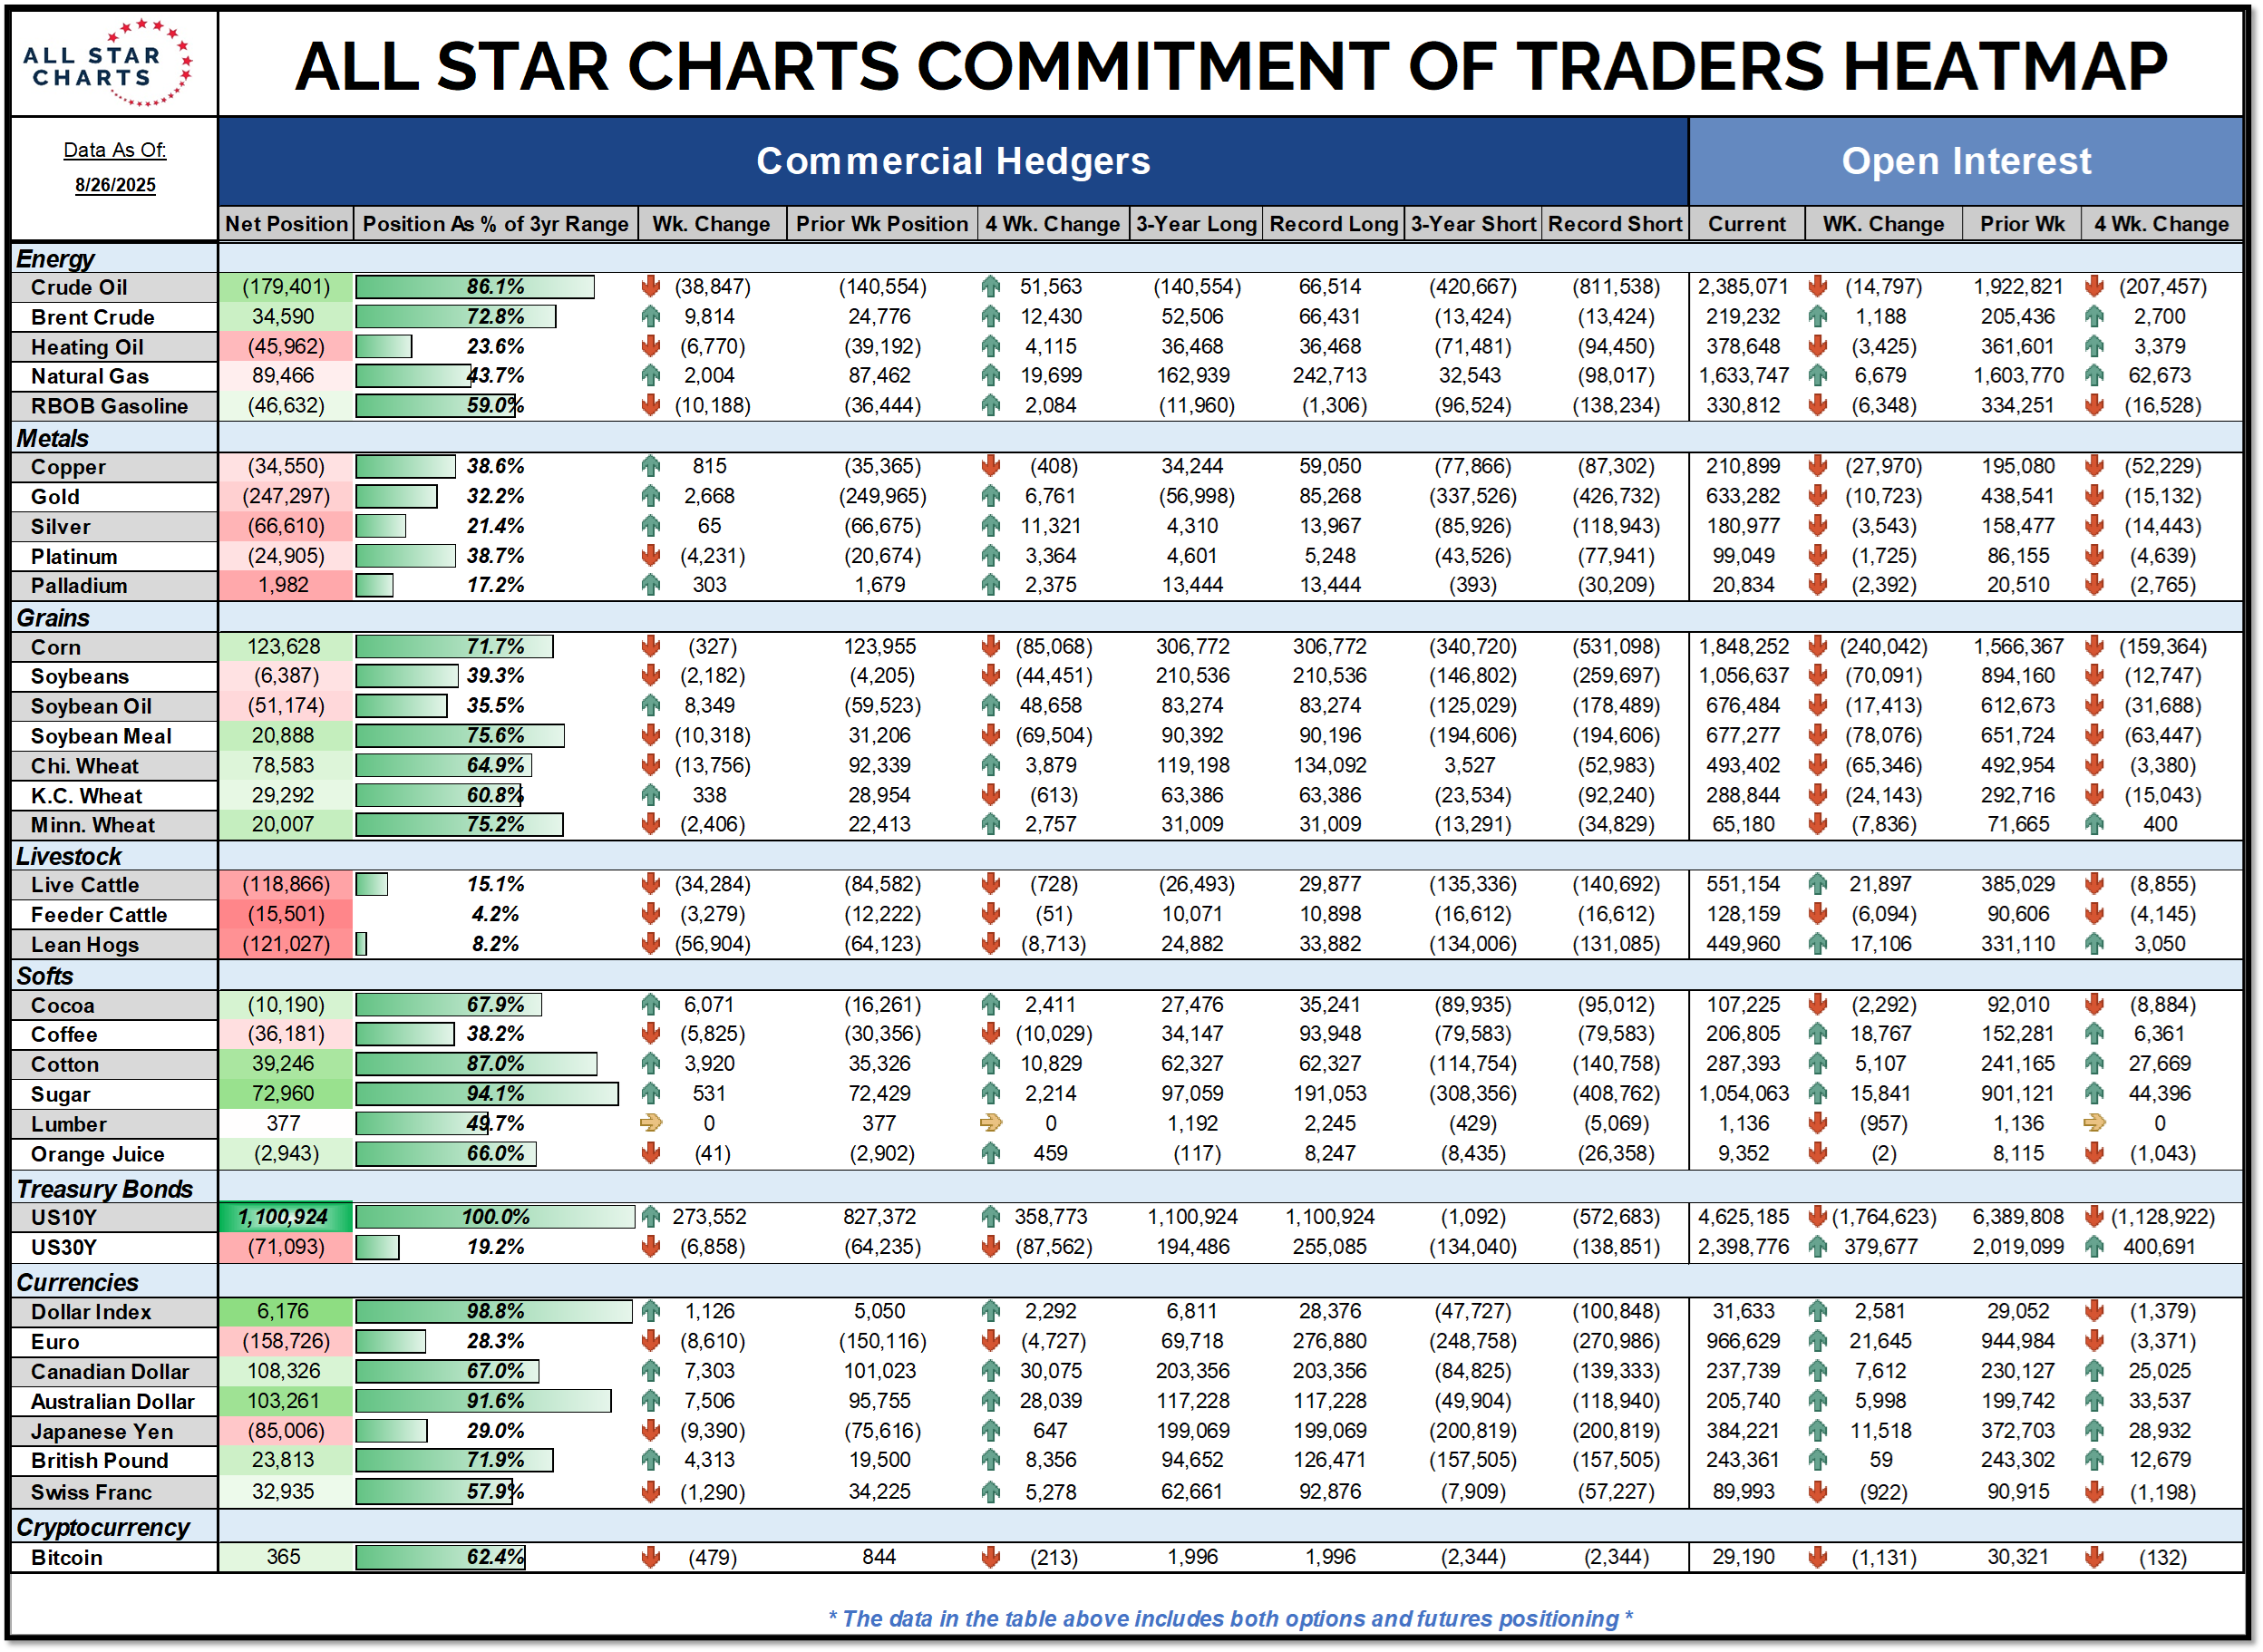
Here's the latest ASC Commitment of Traders Heatmap:
*You can click the table to enlarge the image
The ASC Commitment of Traders Heatmap shows the positioning of commercial hedgers across futures markets, categorized by asset class.
The first column displays the net position, which is simply the difference between long contracts and short contracts. A positive number means commercials are net-long, while a negative number means they are net-short.
Next to that is the position as a percentage of the three-year range. This places today’s positioning in a historical context and helps highlight when commercials lean toward an extreme. When that percentage is near the top or bottom of the range, it often signals crowded conditions that can precede important turning points.
The week-to-week change column tracks how positioning has shifted from the previous week, while the prior week position and four-week change columns give a sense of how these adjustments are developing over time. This makes it easier to see whether commercials are steadily increasing or decreasing exposure.
The table also shows the largest long and short positions of the past three years, along with the all-time records for both. These serve as important benchmarks that allow us to gauge whether today’s positioning is stretched or still within a normal range.
Finally, open interest shows the total number of contracts outstanding, together with changes from the prior week and the past four weeks. Rising open interest alongside an extreme in positioning can add conviction to what commercials are doing.
Taken together, this framework provides a clear snapshot of where the so-called “smart money” is leaning the hardest. It enables us to spot divergences, track momentum in positioning, and identify markets that may be most vulnerable to a shift in trend.
Premium members can see our highlights below 👇
Not a member yet? Join today and get full access to our research.
You need to have a subscription to access this content in full.
Log in or subscribe today to unlock new features and receive Member Benefits.