Last night, JC jumped on the mic for the ASC Premium mid-month conference call — one of the two big ones he hosts each month.
He walked us through over 150 charts, diving into everything from sentiment and sector rotation to risk appetite. Classic top-down work, with plenty of actionable insights along the way.
Here are some of the key takeaways:
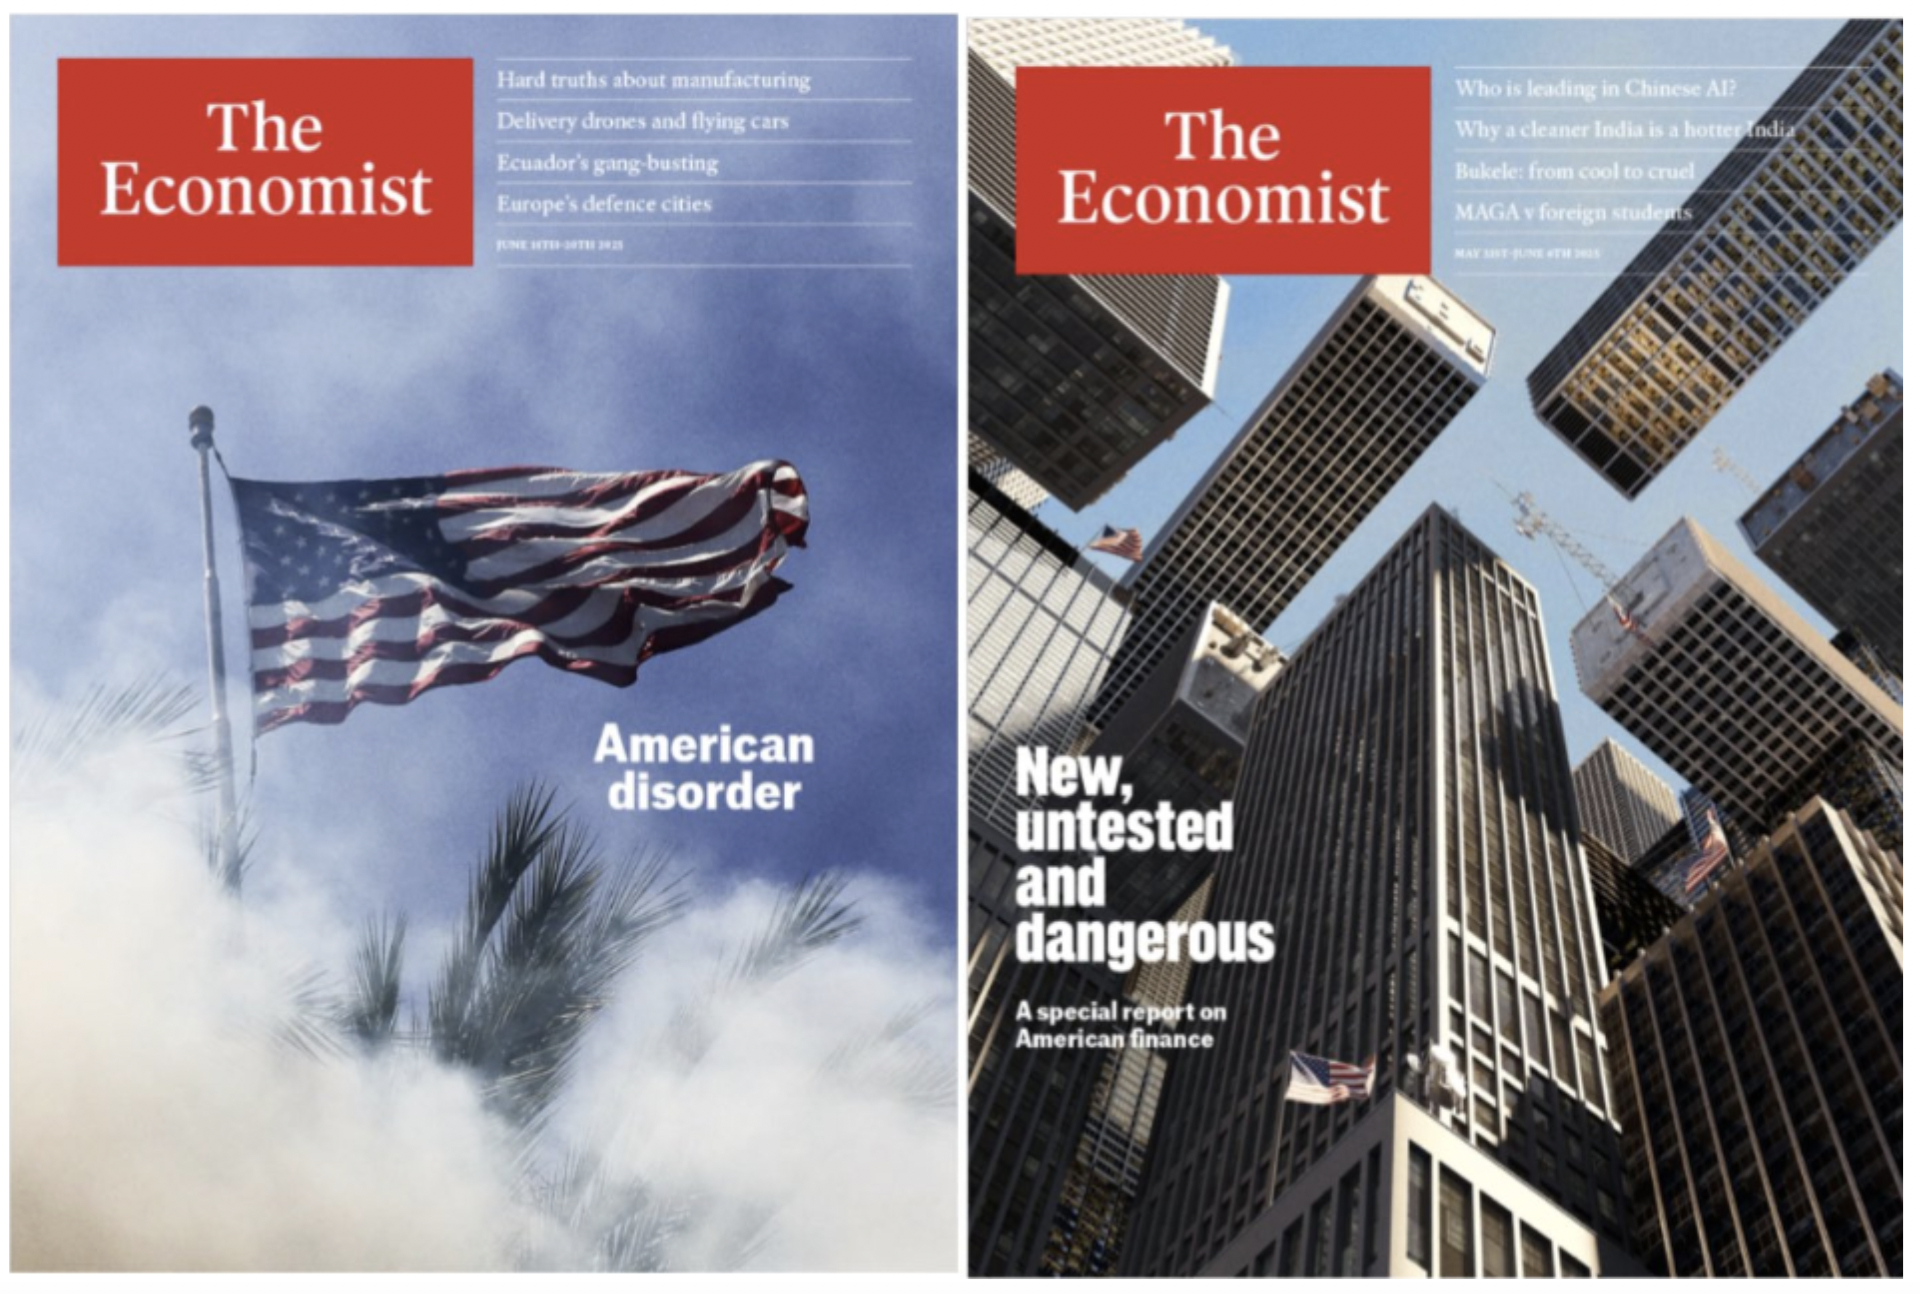
Sentiment is still a mess. The headlines are loud, dramatic, and overwhelmingly bearish.
Journalists dressed up as economists are out there warning that this won’t end well.
Just take a look at some of the recent The Economist covers.
We’ve seen this movie before. There’s always a reason to sell, always a reason to be scared — and yet here we are, with the market grinding higher, completing the V.
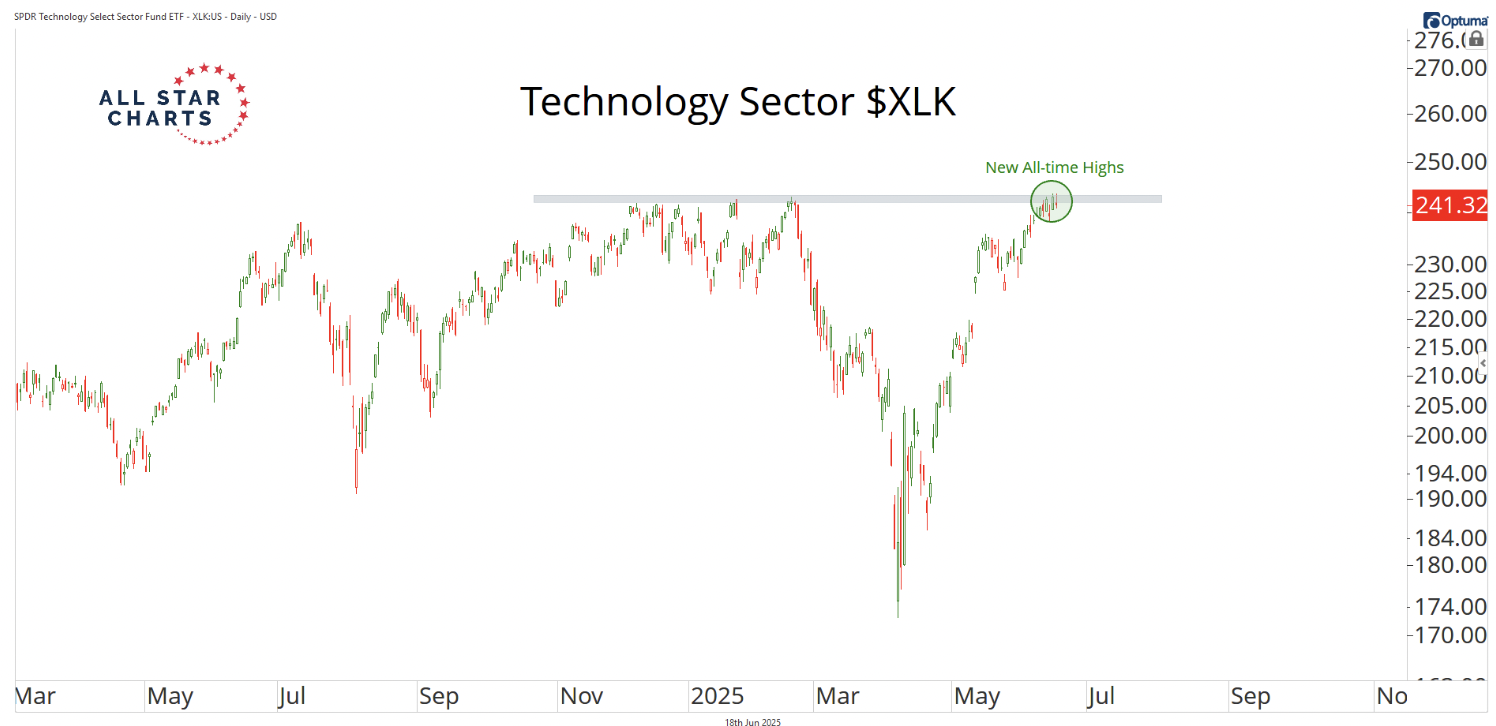
Meanwhile, Technology stocks are flirting with new all-time highs.
These stocks now make up nearly 30% of the S&P 500 — and that’s not even counting Amazon, Tesla, or Google.
It’s tough to be bearish when the biggest part of the market is making new highs.
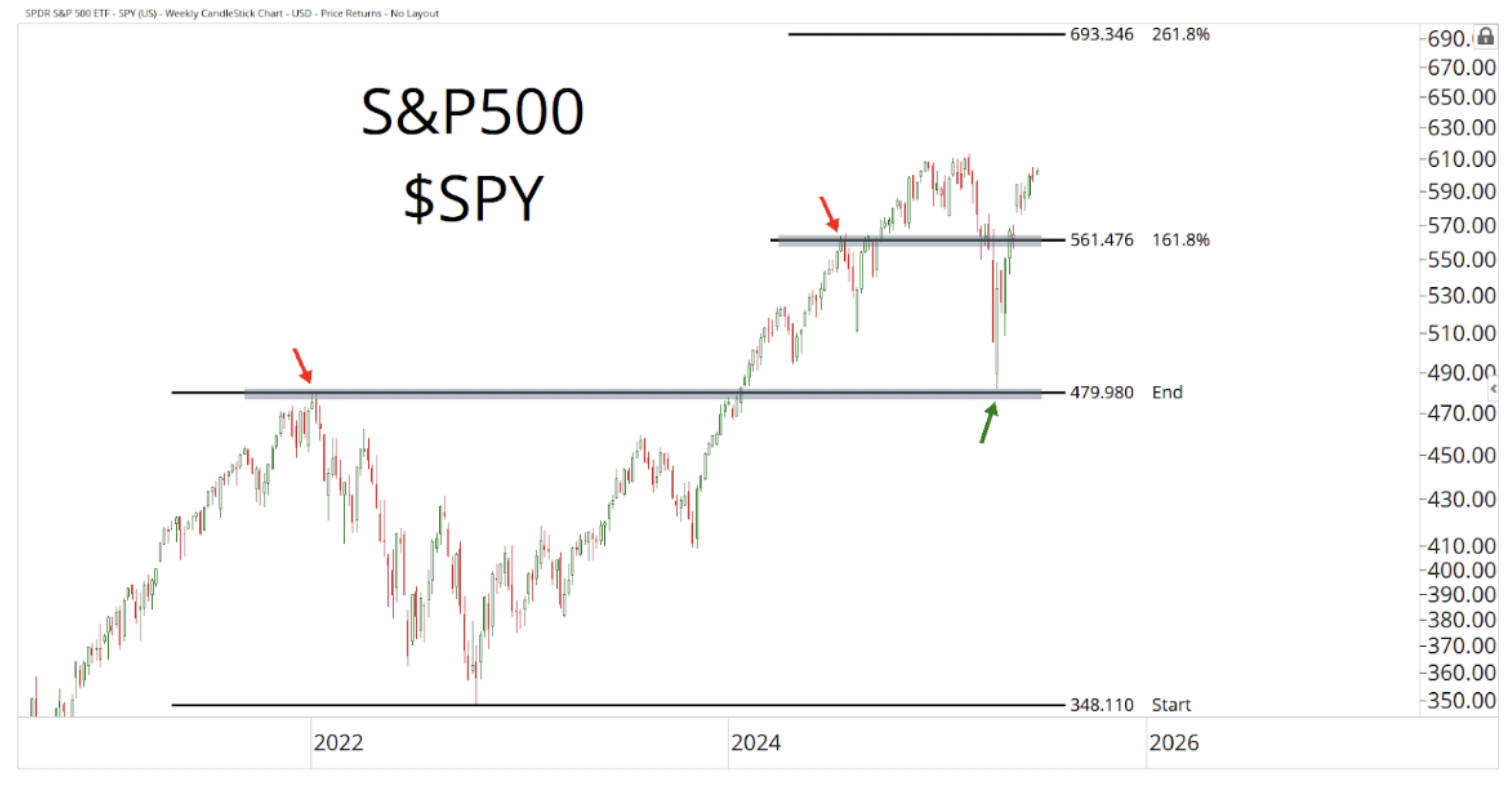
As for the S&P 500, it’s holding above that key 560 level after successfully bouncing off its former cycle highs.
If we’re above that, our stance is simple: we’re betting on a strong back half of the year, and our time is best spent finding stocks to buy.
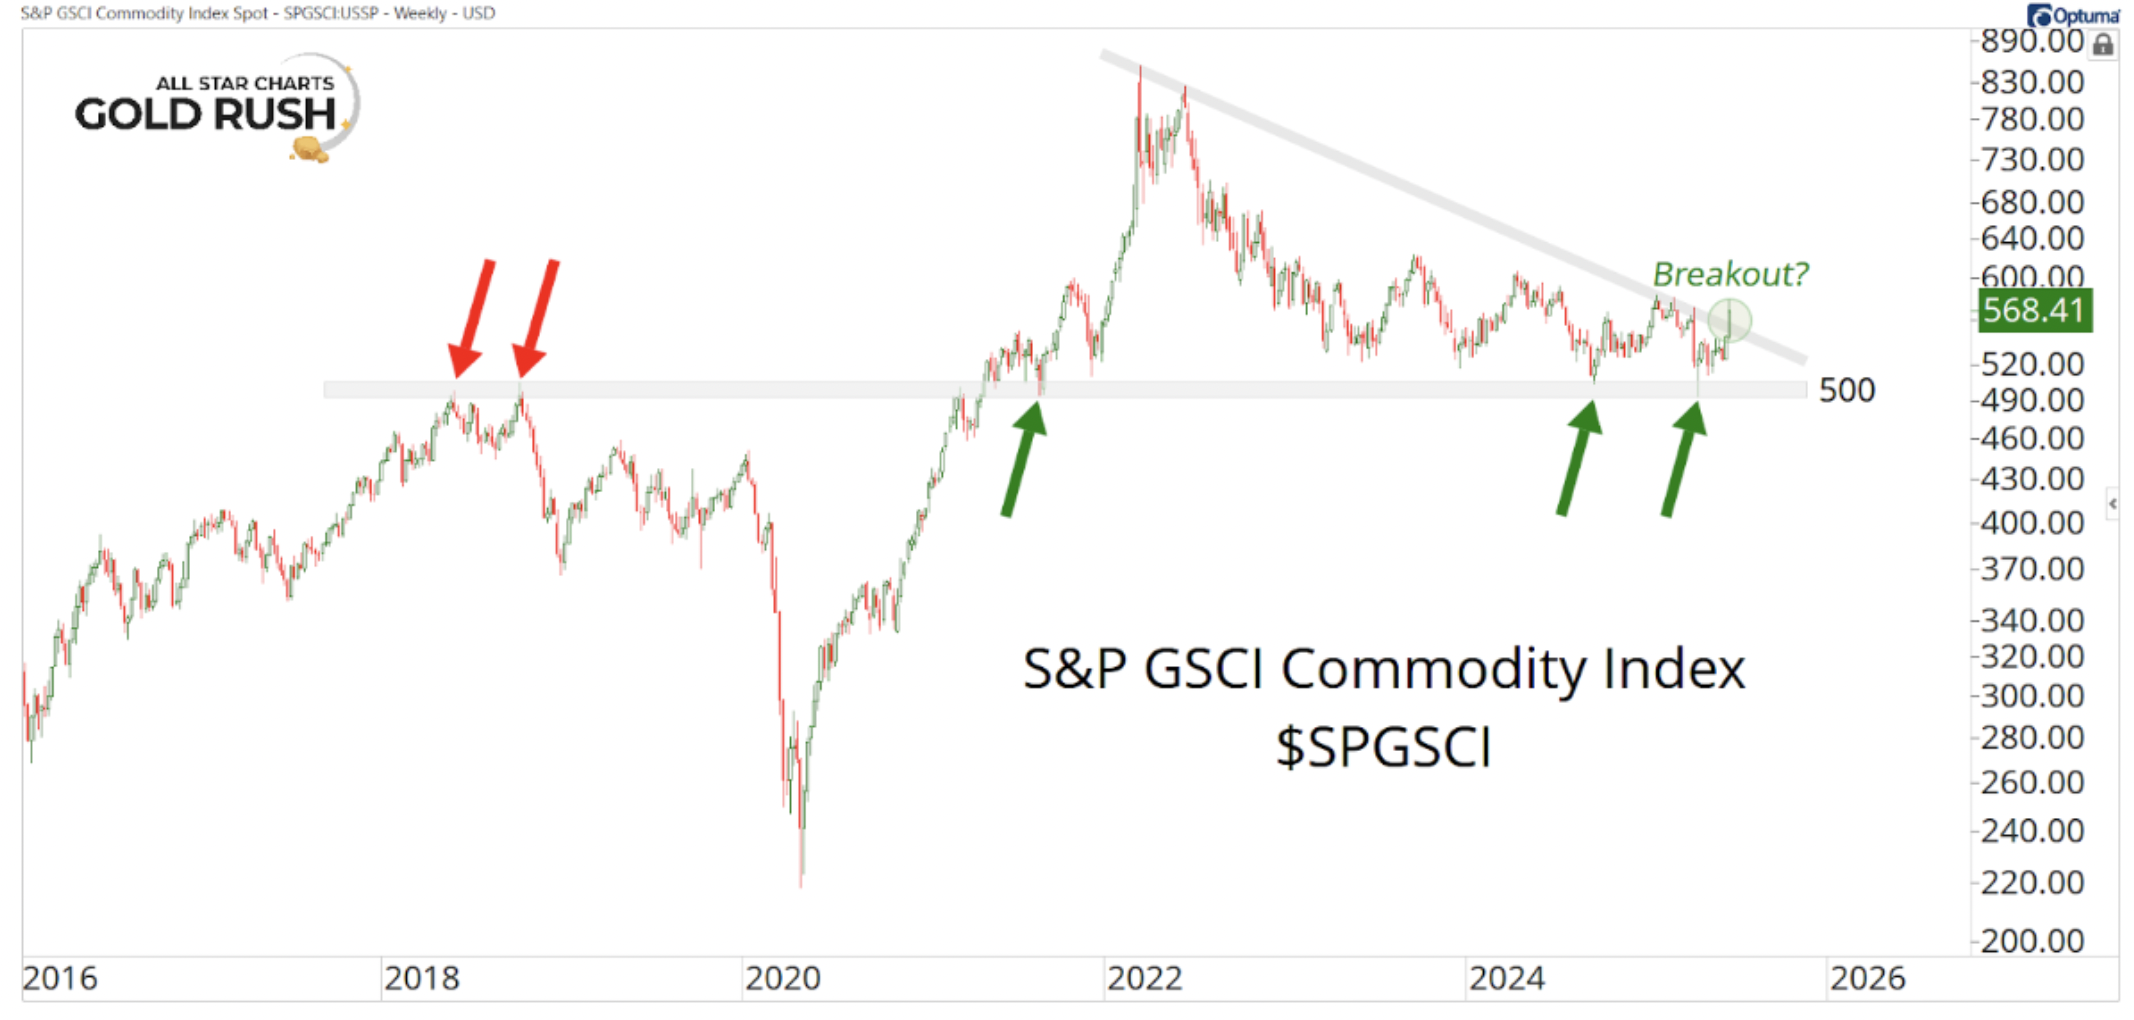
On top of that, we’ve said it before — sector rotation is the lifeblood of a bull market.
Money flows where it’s treated best, and right now we’re seeing fresh strength across the commodity space.
The S&P GSCI Commodity Index just flipped major resistance into support and is now breaking out of a multi-year downtrend line.
Crude oil, heating oil, gasoline — they’re all pressing higher.
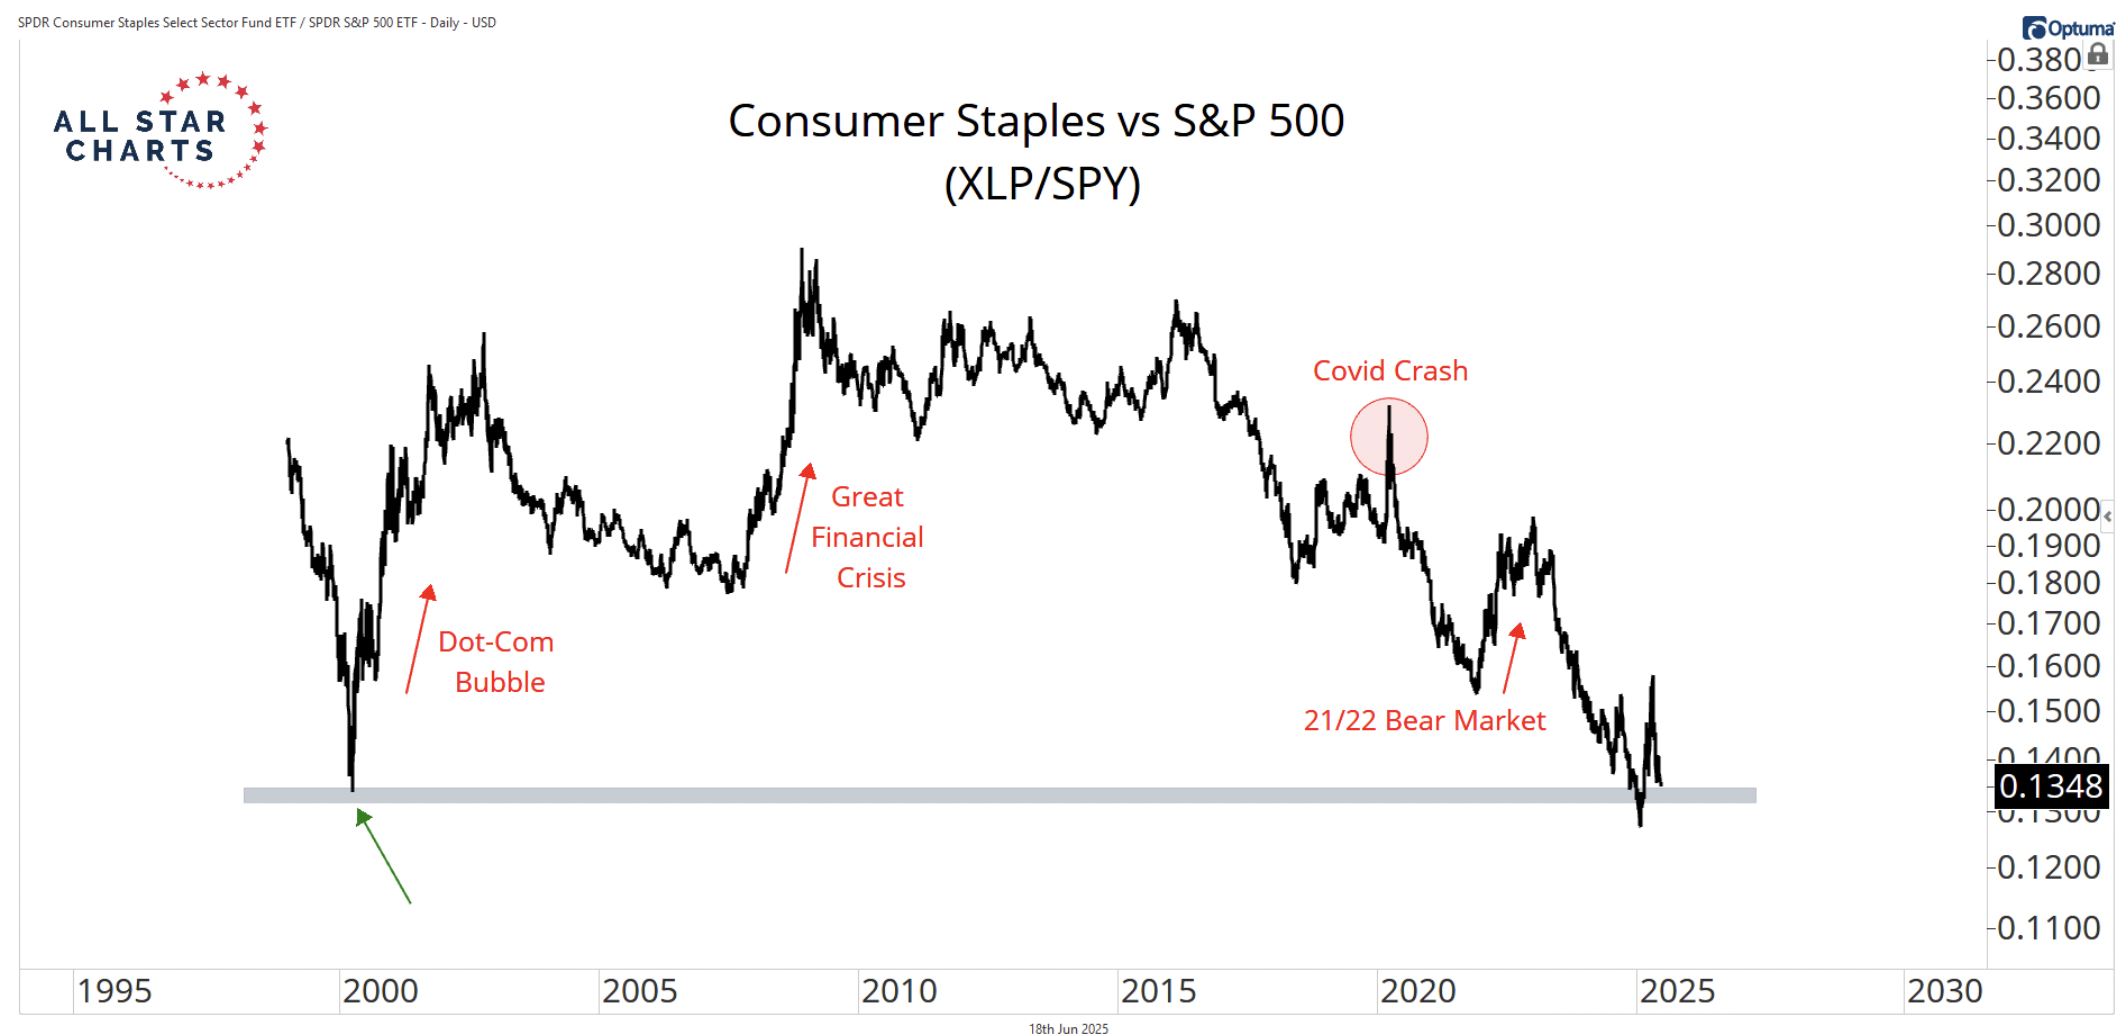
And finally, JC circled back to one of his favorite tools for gauging risk appetite: consumer staples relative to the S&P 500.
If there’s one shortcut to spotting when investors are embracing or rejecting risk, it’s this ratio.
In a healthy market environment, staples tend to underperform — that line usually heads lower.
But when stocks are under pressure, the line moves higher.
Just look at past cycles.
Right now, we’re back at a critical level of interest in the XLP/SPY ratio.
If we break down through this support, we can’t think of anything more bullish for equities. But if it holds and reverses, that’s probably happening in an environment where stocks are under stress.
Either way, it’s a chart we’ll be watching closely.
If you want to be on these calls live, see all the charts in real time, and get access to the trade ideas we’re discussing, come join us inside ASC Premium.