For traders, being early is just as bad as being wrong.
And I’ve been early on energy. There’s no doubt.
We’ve taken some shots with call options and they haven’t worked.
But I’m also building and increasing long-term positions in the traditional oil & gas space. Nothing fancy. I’m talking about the largest integrated players around the globe.
Exxon, Chevron, Canadian Natural, Petrobras… I’m leaning into the big boys in my long-term account. How about those dividend yields?
And the data keeps telling me I’m on the right track.
Pull up a price chart and tell me I’m crazy. Because you’d be right.
Energy bulls are trying to catch a falling knife right now. That’s a top in crude for the time being…
However, my technical upbringing has me focused on other things. I’m a John Murphy intermarket disciple. I’m a puzzle builder. A big picture guy.
And right now the intermarket evidence is screaming at me and telling me not to trust the price action in energy.
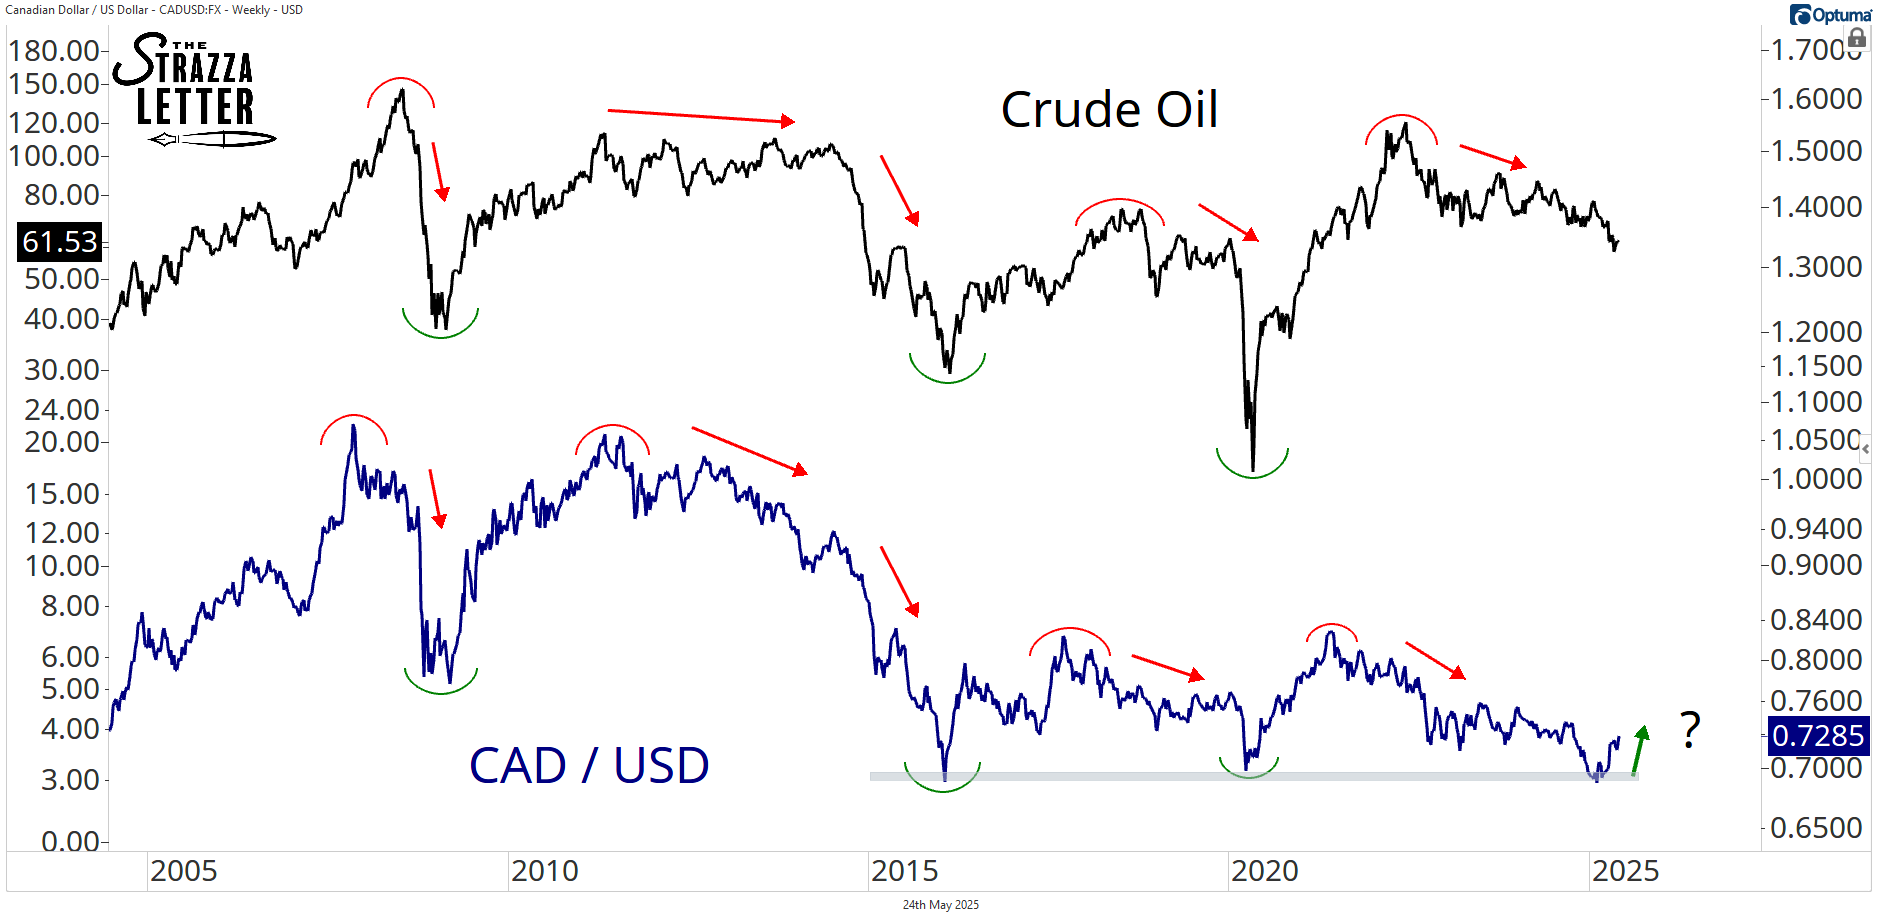
The list is too long I won’t bore you. But let’s talk about a big one today. Here’s crude overlaid with Canadian dollars.
Most of you are familiar with the correlation. Canada is all about natural resources, and crude tops that list.
These charts move together throughout history. The further you zoom out, the stronger the positive correlation.
There’s a lot marked up in this chart to show that point. But let’s drill into the bottoms and focus our attention there.
Crude and CAD can dislocate over time. You’ll see that if you dive into this correlation and shorten the timeframe.
But here’s what doesn’t happen.
Canadian dollars don’t break out and sustain new highs while crude oil completes a massive top. It’s literally never been the case.
If this is a valid bottom in CAD, I promise you crude isn’t breaking down. Just look back at all the bottoms on this chart. See all those green arcs?
Are we betting this time is different? How could we?
Find me another time that happened in this relationship. Go back as far as you can. Both these assets have been around since the 1800s. And they’ve been grooving together the whole time.
is making new 52 week highs.
And crude is trading around multi-year lows, baiting market participants to take a shot on the short side.
One of these assets is going to be very wrong. It’s going to catch higher or lower and get in line with the one that’s right.
And when we look through history, that kind of thing can go either way.
So the question is simply who do we trust here?
What asset is showing us the right price action- crude or CAD.
My bet is CAD and I’ll tell you why.
Just look at everything else.
We can now basket the action in CAD with other commodity currencies. Those charts have been suggesting higher gold, copper, and oil prices for a while now.
And how about inflation expectations and interest rates. They are giving us the green light on commodities too.
And how about just risk assets in general. Bitcoin. Stocks. Risky stocks, to be specific.
We have our offense on the field.
The data continues to support this behavior.
I’m not going to bet on oil & gas topping out and rolling over in the middle of an explosive up-leg for risk assets around the globe.
I’m betting crude and energy stocks scoop and score. I’m betting that this failed move morphs into a fast move. I’m increasing my O&G exposure. I’m doing it through international vehicles as much as possible. We’re long gold. We’re taking shots on silver. We’re betting on some big catch-up from copper. And we’re betting oil & gas follows these commodity leaders.
I’m a gut trader. I anticipate the next big thing. And I can’t stop thinking about energy right now.