“I’m making the bet that crude scoops and scores here. I think it should look a lot more like its derivative plays soon, back in its old range. And I think we can get a fast move back toward the upper bounds from there. I’m talking about a big rally that sends crude back to the 80s or 90s”.
Why in the world was I feeling so warm and fuzzy about crude oil?
It was just completing a massive top. What a naughty technician I must be. What was I thinking?
I’ll tell you… It was all about the intermarket.
JC is one of the top intermarket minds currently practicing, and I’ve learned a lot from him over the years.
Before that, I was a John Murphy disciple. I think the Murphy intermarket text is one of the single most important pieces of technical analysis literature.
JC and I recently had the privilege of helping with the relative strength and intermarket material for the new CMT text. It was quite the honor.
But the point is, we spend a lot of time thinking about and analyzing the intermarket landscape. It’s one of the ultimate cheat codes… if you can figure it out.
It’s the puzzle-building aspect of what we do. We’re not looking at these charts in a vacuum, of course. We’re analyzing price action here… within the context of what’s happening over there.
I’m thinking to myself, is this going to be a top in crude… if these are not tops in heating oil and gasoline?
Is crude oil about to roll over… with energy stocks scooping and scoring off the April lows?
Is it game over for the entire energy complex… in an environment where more and more commodities are working every day?
Should we be bearish energy… with commodity and energy-centric countries and currencies taking on a leadership role around the globe?
The answer to all of these rhetorical questions is a hard NO.
And with the action from crude oil this week, the market is confirming my failed top thesis to be true. However, if you were only looking at the chart of crude, you would have missed it.
It wasn’t there. It was everywhere else.
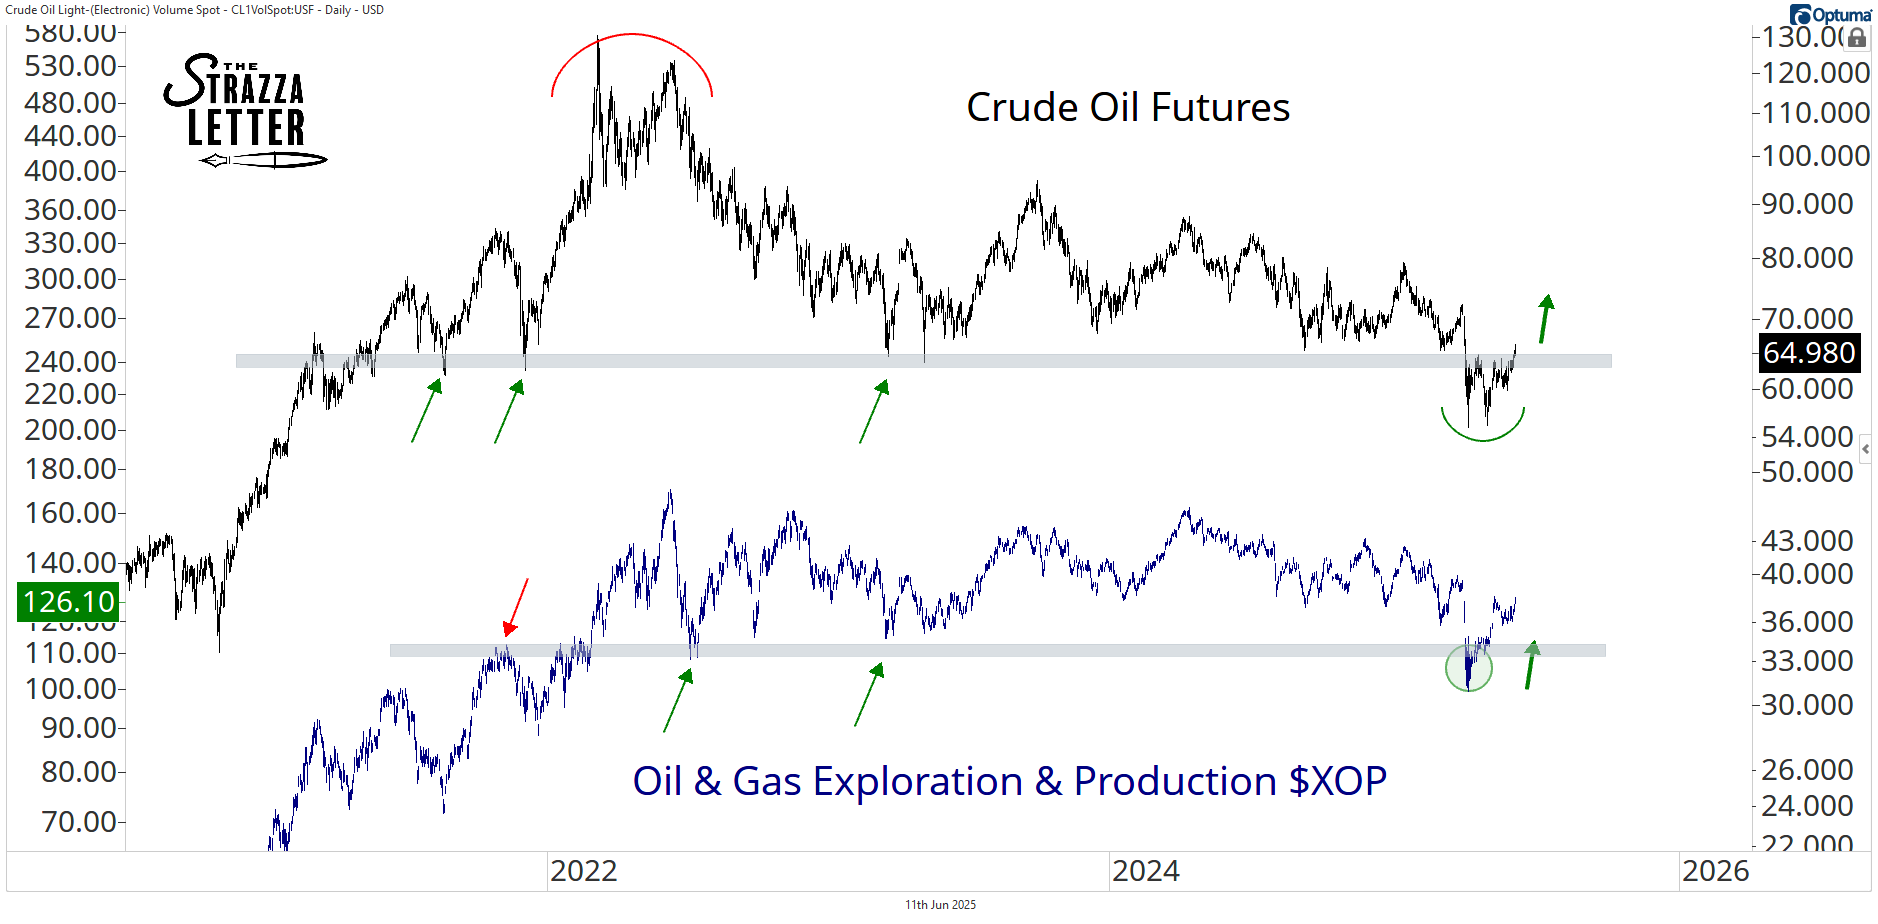
So here it is, trapping the bears and ripping higher. It booked its best day in two months today, up 5.50% on the heels of geopolitical headlines.
And instead of the derivatives, I’m overlaying it with the exploration & production index $XOP this time.
This basket of risk-on energy stocks has been leading the charge for the whole sector recently.
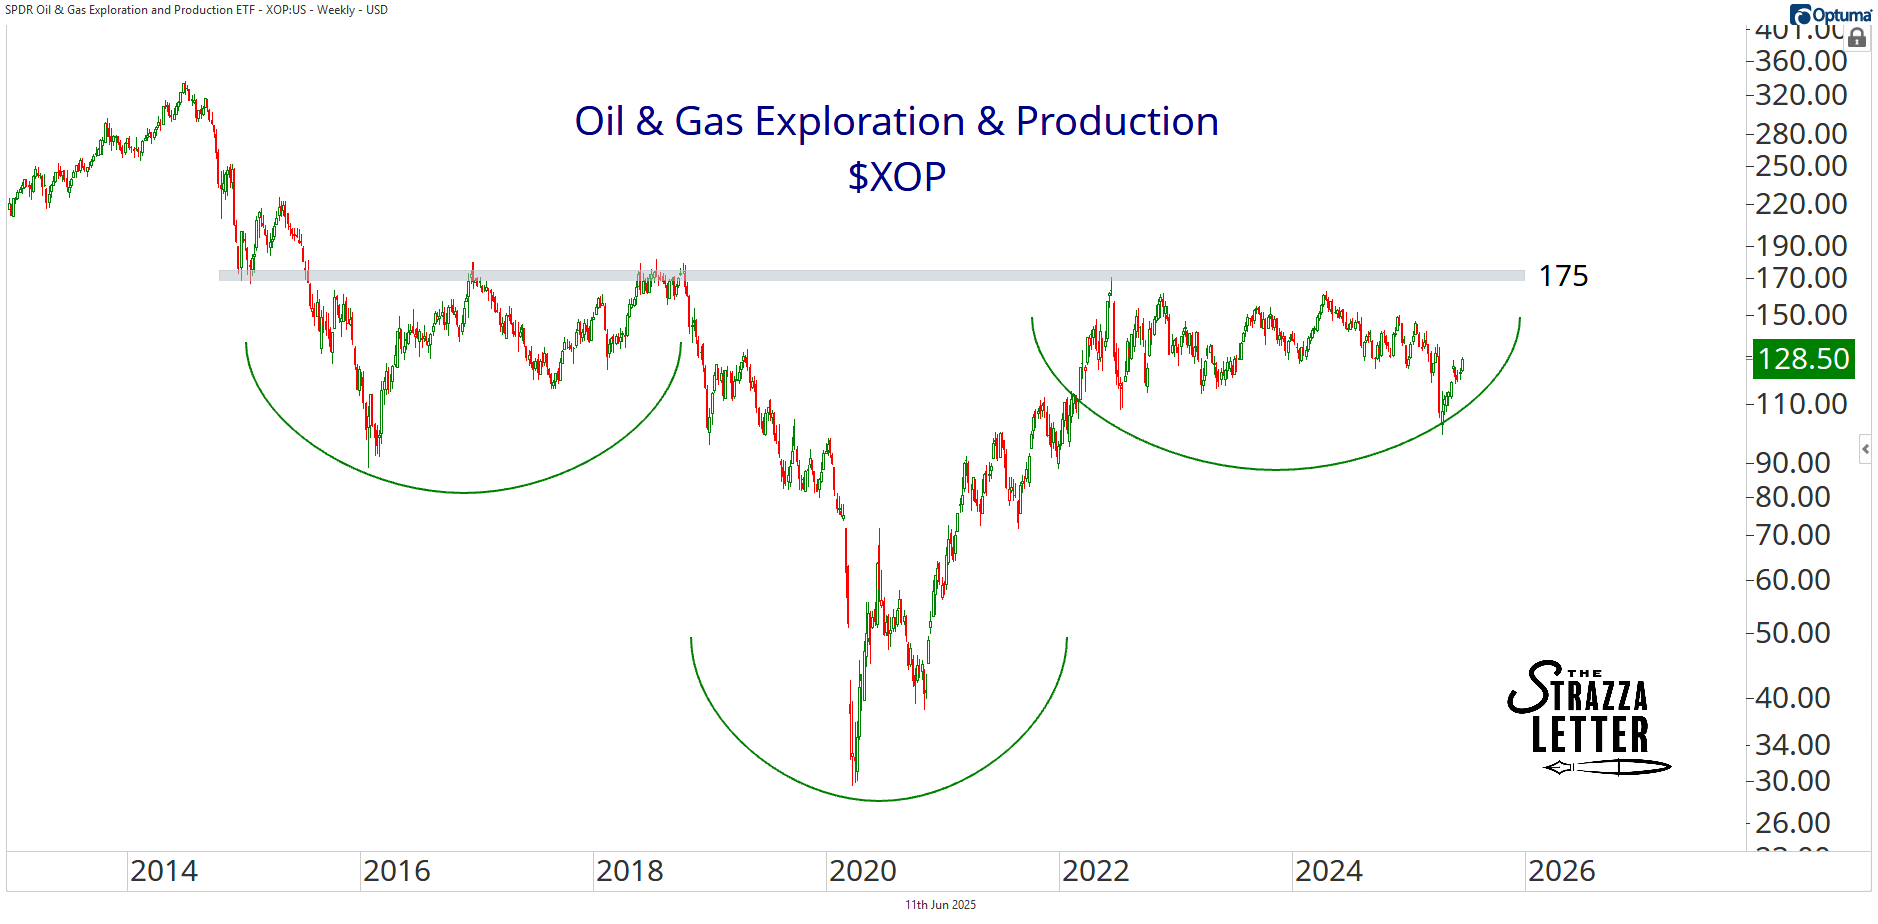
Here it is zoomed all the way out:
If XOP is above 125, the bias is higher toward the polarity zone at 175. And from there, I think we go back to the old all-time highs around 330.
However, I think the best individual opportunities are in the top stocks in this subgroup. We outlined some of our favorites in a recent deep dive. You can sign up for ASC Premium risk-free today, and can access that report here.
And we’re going to trade these waves in energy all day via Breakout Multiplier. The energy trades we put on last week are already working. We just sold a double in our $USO calls today. Join the Breakout Multiplier team to get the next one!