Plato’s allegory of the cave endures because it speaks to the nature of perception.
Prisoners chained in darkness see only shadows on the wall, mistaking them for reality.
When one escapes, the illusion is revealed - the real world lies beyond the cave.
The story is more than philosophy - it is a mirror.
To recognize the walls is to weaken them.
To see the shadows for what they are is to begin walking toward the light.
Markets are the same.
Traders get trapped staring at shadows - price action that looks random, disconnected, and meaningless.
But markets leave clues... Step back far enough, and the structure reveals itself.
Take this chart, for example:
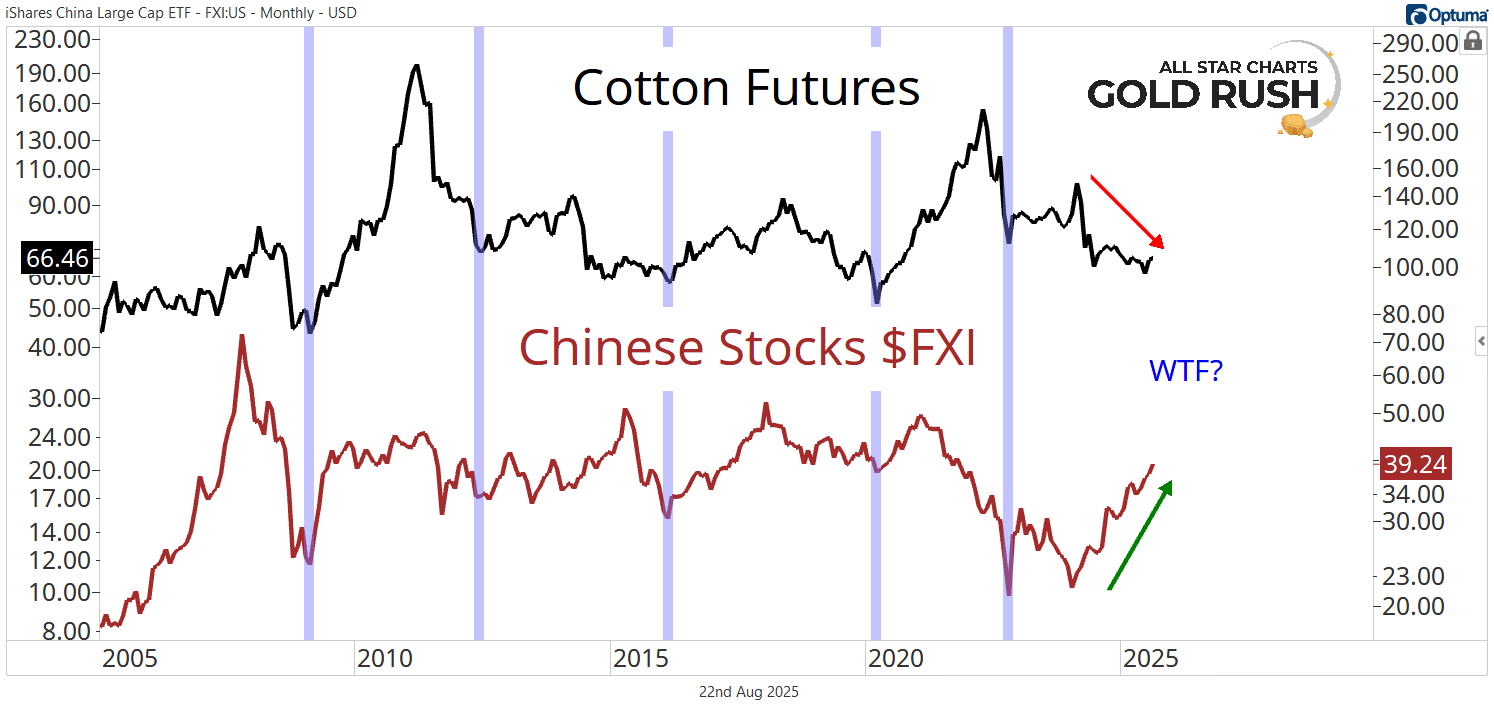
Chinese stocks, represented by the iShares China Large Cap ETF $FXI, and Cotton futures have moved together for decades.
Both are tied to Asia’s demand, and reflect the flow of U.S. cotton exports into Chinese manufacturing and consumer markets.
In recent years, we've seen a significant divergence between the two lines.
Cotton is lagging while Chinese stocks are in the middle of a historic rally.
Most see noise in this chart, but we see shadows on the wall.
History says they don’t stay apart for long, so we want to bet on an eventual convergence.
Asia remains the largest consumer of Cotton, and China is still one of the biggest buyers.
That demand doesn’t disappear... The disconnect is the illusion, and the reversion is reality.
To us, this isn’t a random “WTF.”
It’s the cage, and the market just left the door open.
We remain bullish on Chinese stocks, but we're also watching Cotton - because when illusions crack, prices snap back with force.
That’s often where the biggest trades are born.
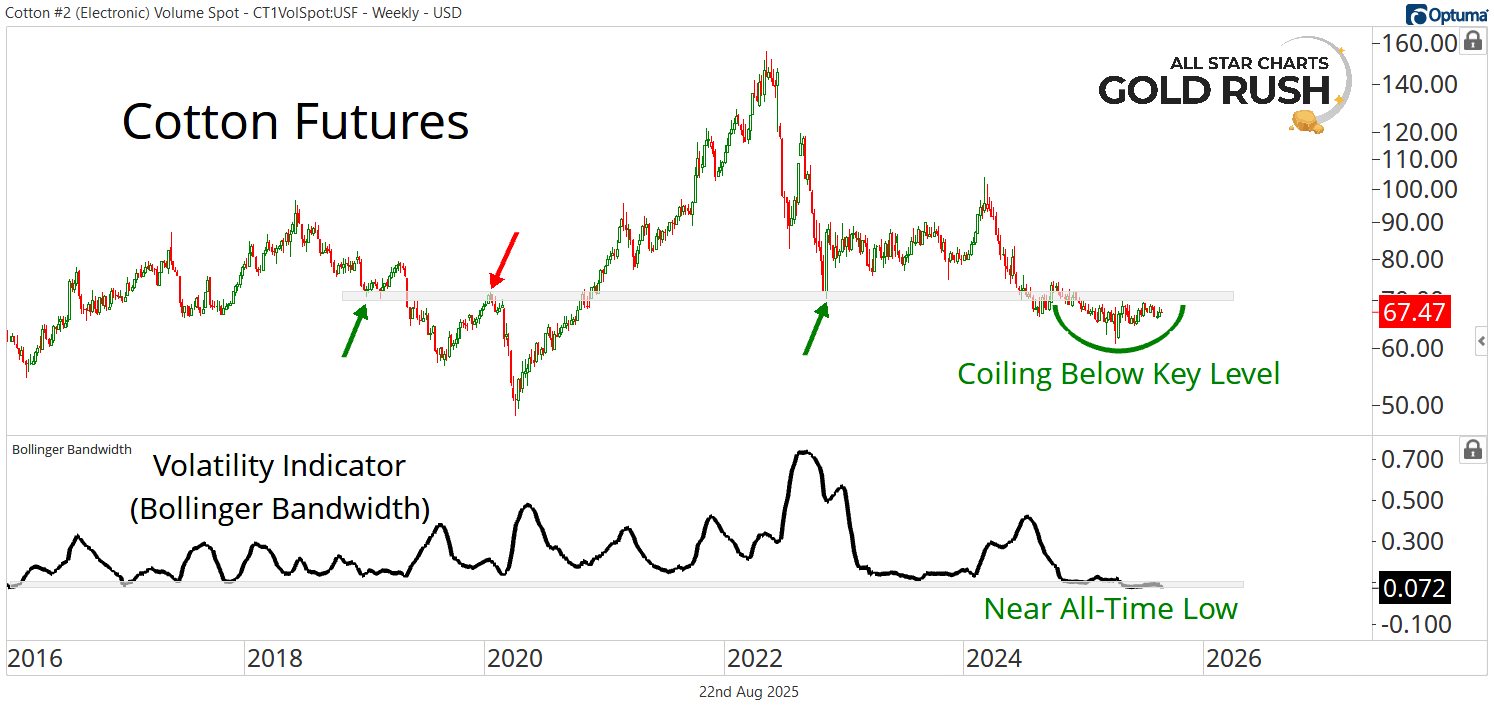
We're seeing historic volatility compression in Cotton futures:
As you can see, Cotton futures are coiling beneath a critical level of former polarity. The market has repeatedly indicated that this is a key level of interest for both buyers and sellers.
Below it, we know the sellers are in control, and vice versa.
The weekly volatility indicator (Bollinger Bandwidth) is near all-time lows - a signal that a significant move is brewing.
When volatility contracts to this degree, the release is rarely subtle.
Here's how we'll know when the volatility squeeze is underway:
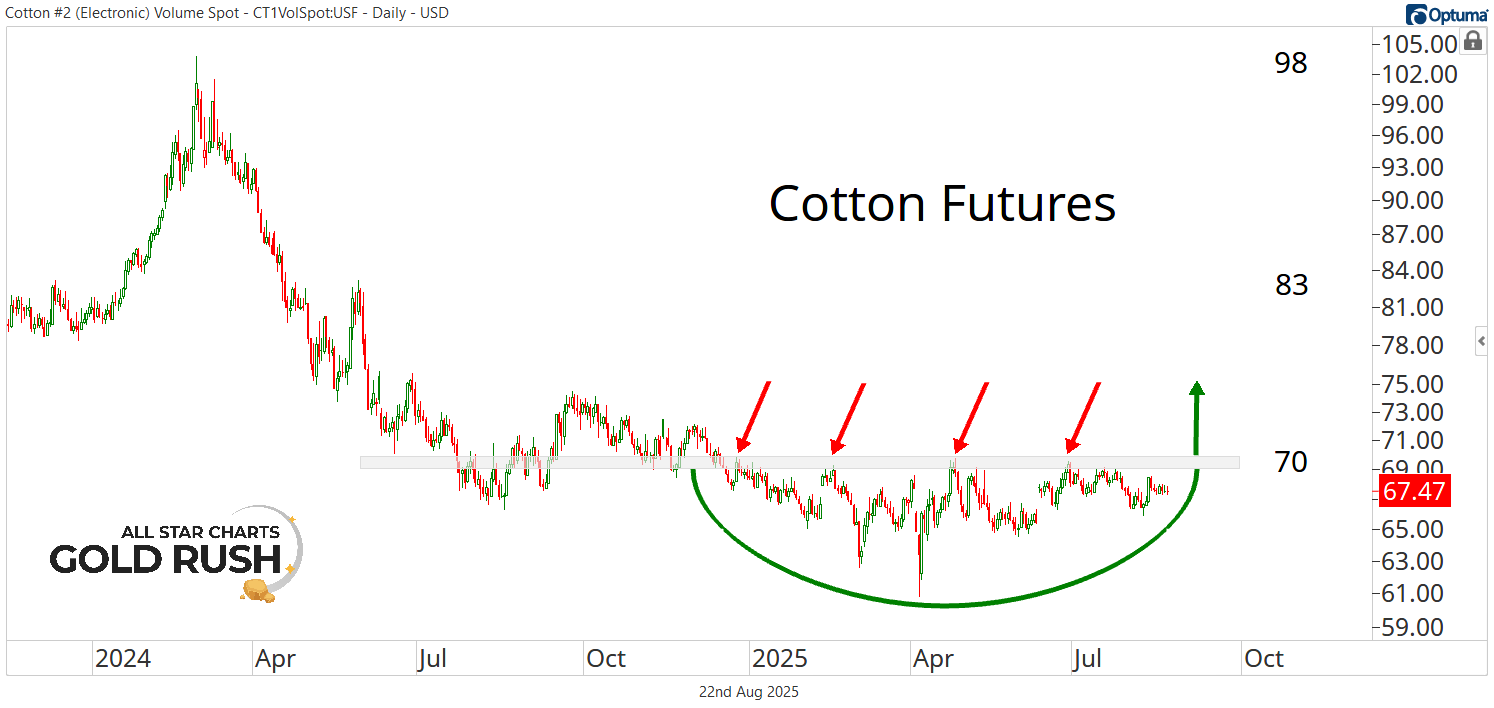
When we look at the daily chart, the setup is clear as day.
Cotton futures have been carving out a textbook bearish-to-bullish reversal pattern for all of 2025.
Now, the bulls look poised to put the finishing touches on it any day.
There is a tremendous amount of pressure building under the surface, and we expect the resolution of this base to be extreme.
We want to buy Cotton futures on strength above 70, with a target of 83 over the coming 3-6 months. Over longer timeframes, we're looking at a secondary objective of 98.
The catch-up potential in Cotton futures makes it one of the most attractive risk/reward setups in the entire commodities complex.
And if Plato taught us anything, it’s that the shadows on the wall aren’t the truth.
Step outside the cave, and the trades become obvious.
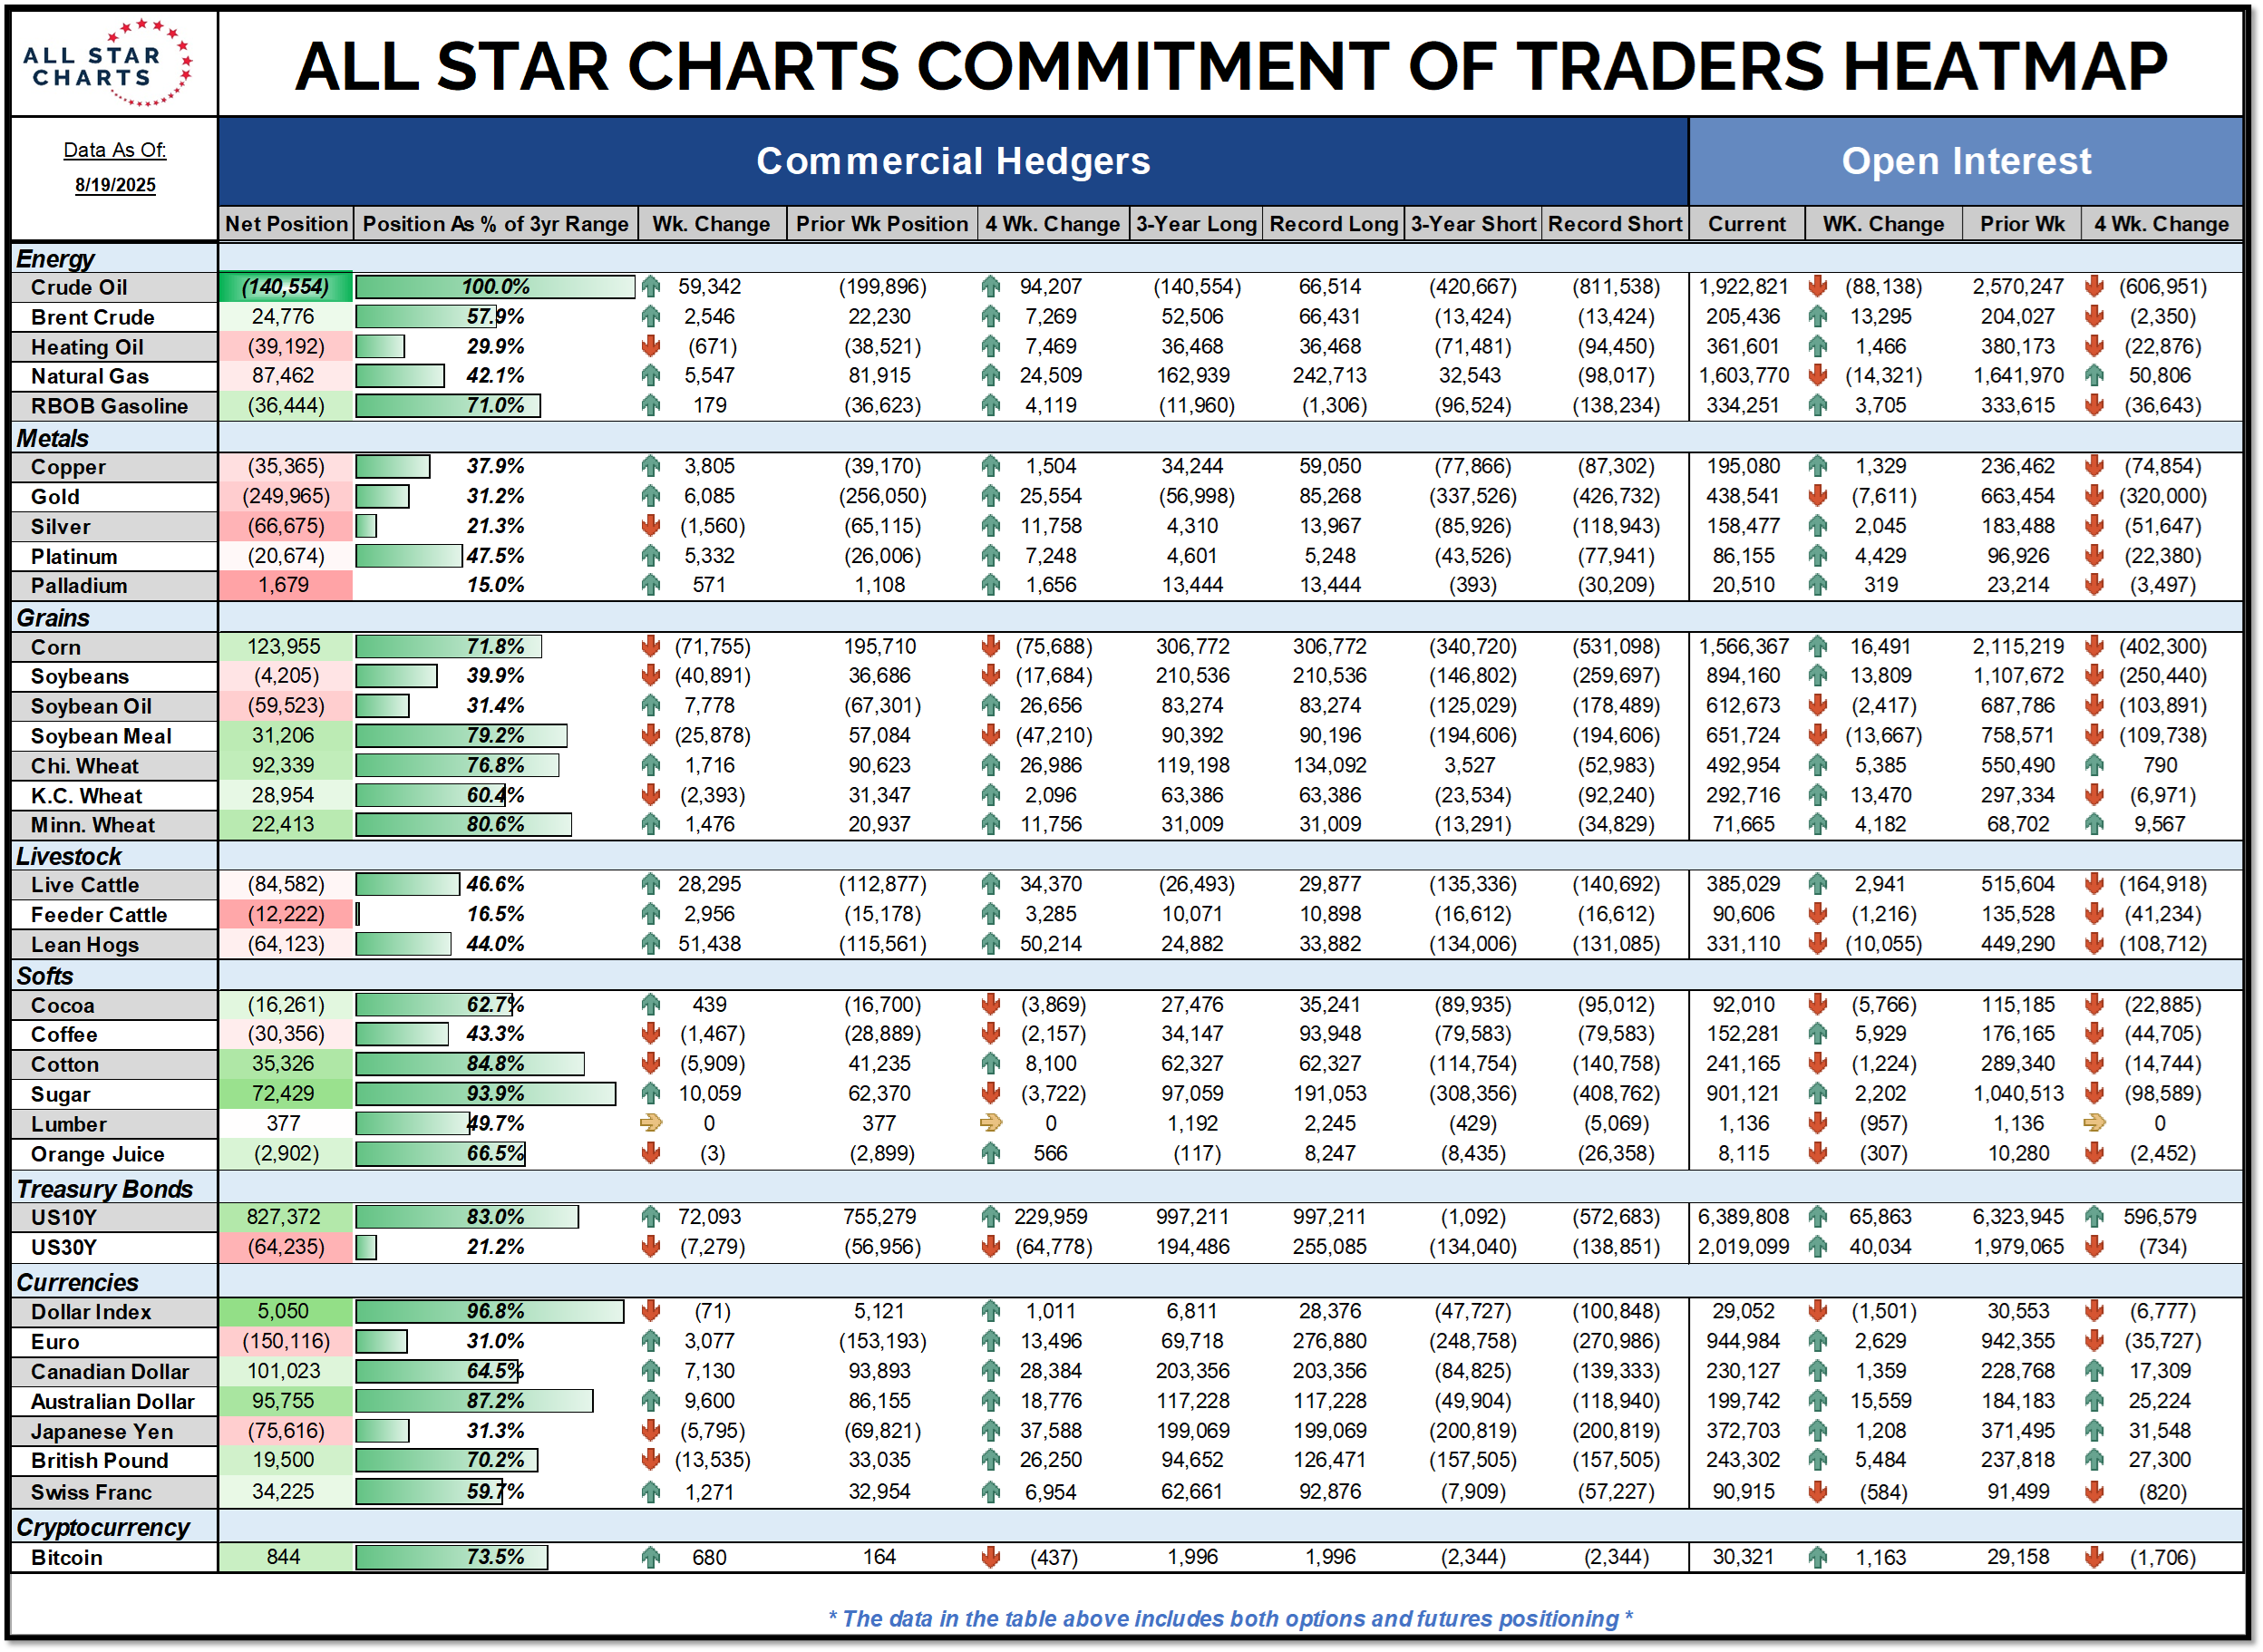
Energy - Commercial hedgers are holding their smallest net-short position in Crude Oil in years. That's the opposite of what we typically see in energy bull markets, when commercials build massive net-short exposure.
Fixed income - Commercials added more than 7,000 contracts to their net-short US 30-Year position, and boosted their net-long US 10-Year position by 72,000 contracts. This suggests the smart money is anticipating a bear steepener.
Precious metals - Commercial hedgers continue to accumulate Palladium, after briefly flirting with net-short territory. We see this as a potential headwind for the bulls, since the strongest uptrends in this metal usually occur when commercials are heavily net-short.


