Bond yields are breaking out as onshore drillers take the lead.
There are easier jobs in Washington than running the Federal Reserve.
Jerome Powell inherited the chairmanship near the end of one cycle, navigated the fastest economic shutdown in modern history, watched the most aggressive monetary and fiscal...
The biggest weekly rally since 2020 confirms a powerful shift in the primary trend.
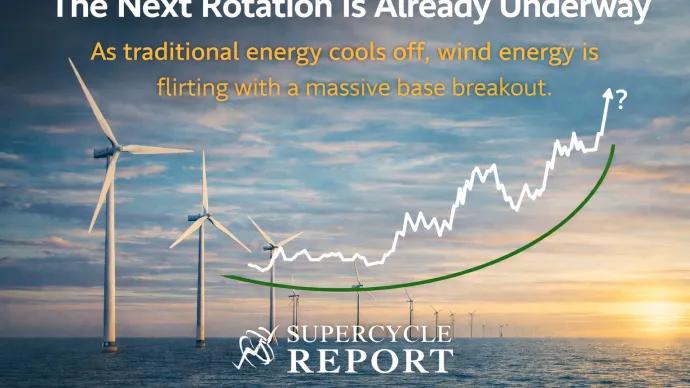
Over the past several weeks in Commodities Weekly, we’ve been laying out a very clear thesis: energy is in the early stages of a major leadership cycle.
Early-year rotations are opening opportunities in soft commodities.
We’ve officially closed the books on 2025, and the scoreboard tells a very clear story.
If you were long precious metals last year, it was a feast. Silver, Platinum, Palladium, and Gold dominated the commodity complex, and it wasn’t even close....
Seasonality and structure suggest a broader commodities breakout ahead.
As we head toward the close of the year, commodities are quietly reaching an inflection point that’s easy to miss if you’re not looking at the big picture.
For most of this cycle, leadership has been narrow. Precious metals did the heavy lifting...
Base metals are entering a brand-new primary uptrend.
This entire year, we’ve been pounding the table on one idea: investors are wildly underestimating the structural shift unfolding inside base and industrial metals.