When you step back and look at the commodity space today, one thing becomes obvious: the rotation is broadening.
Gold has already done the heavy lifting, and the miners have already completed their bases. Precious metals have decisively entered brand-new primary uptrends.
And now the question isn’t whether the move continues, it’s which group is next.
From where we sit today, that answer is becoming increasingly clear. The next stage of this rotation is shifting into the base and industrial metals, and Copper is positioned right at the heart of it.
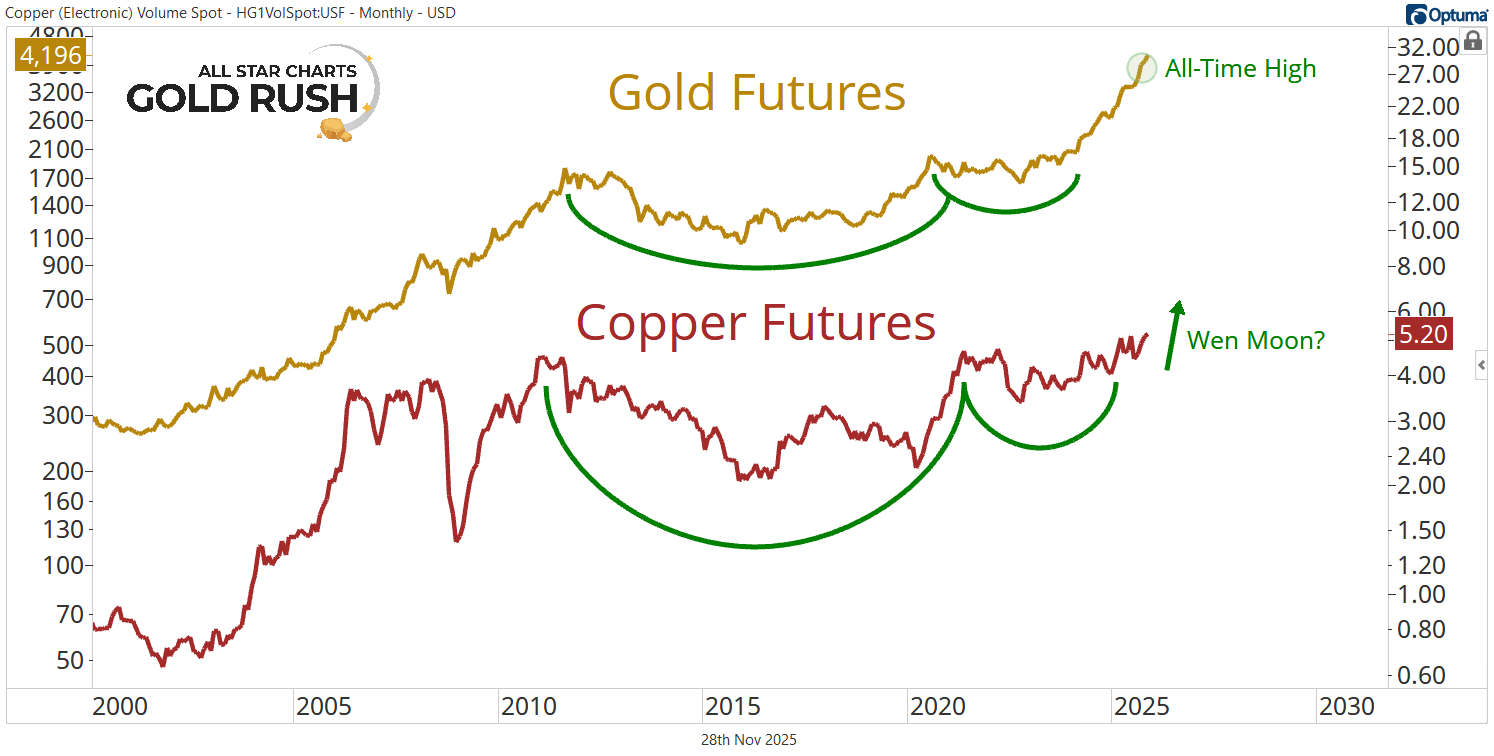
Let’s start where this rotation begins: with the futures themselves.
On March 4, 2024, Gold futures decisively put the finishing touches on a nearly 15-year accumulation pattern. Since then, they have doubled.
What stands out about Gold’s move isn’t just the breakout itself, but how orderly the entire structure has been: strong momentum, shallow retracements, and a steady march into uncharted territory.
The chart of Copper futures is identical. Just delayed...
That’s the opportunity. We're betting on an epic catch-up trade.
And with Copper futures closing November at a fresh all-time high, the move has already started.
If the red metal is the next one to break, the biggest beneficiaries aren’t the futures. It’s the miners.
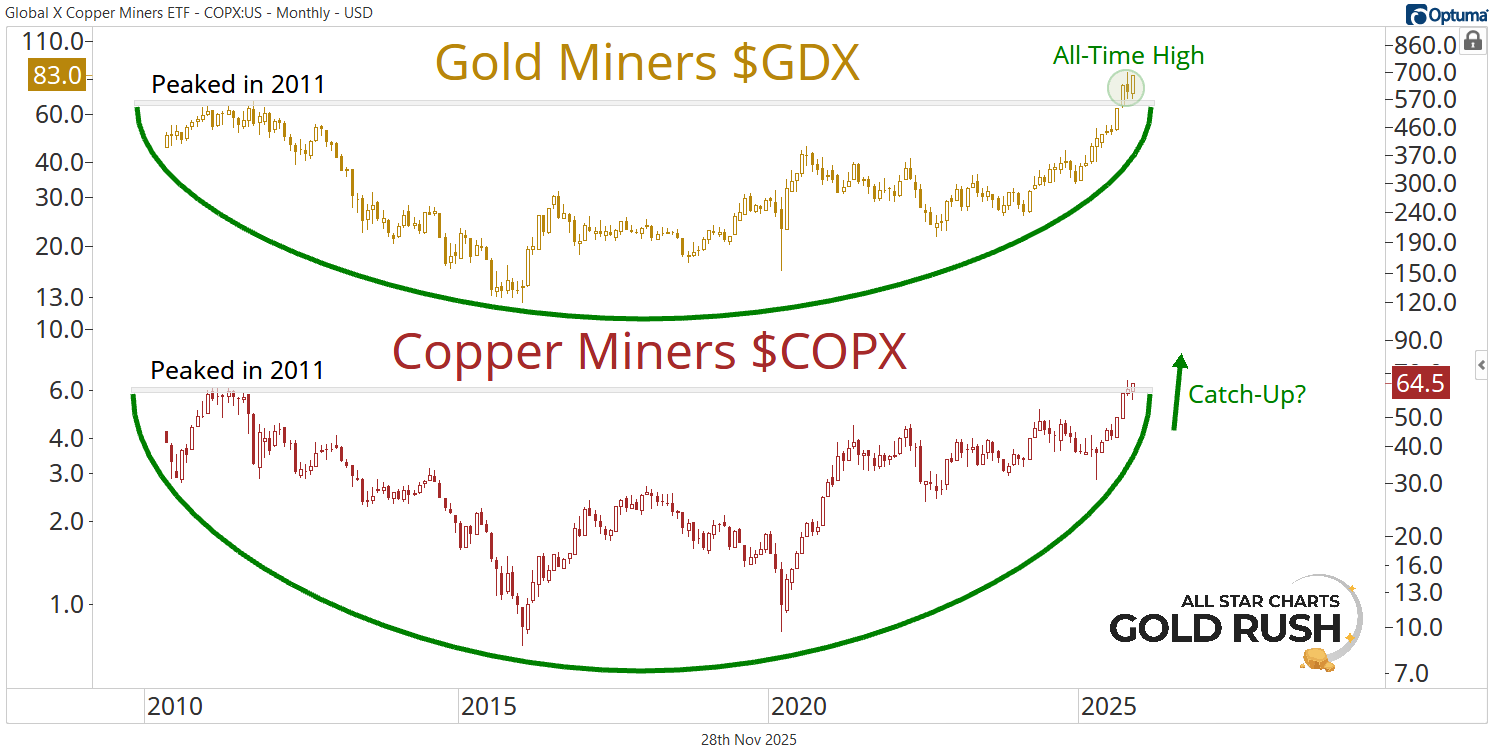
Back in September, we pointed out the widening gap between the VanEck Gold Miners ETF $GDX and the Global X Copper Miners ETF $COPX.
GDX had already broken out to new all-time highs, completing a massive accumulation pattern.
Meanwhile, COPX remained stuck below its 2011 peak.
We said then that if the golden line is breaking out, the red line probably isn't far behind.
Fast-forward to today, and that’s precisely what happened. The price has ripped to and through the 2011 peak in a vertical line.
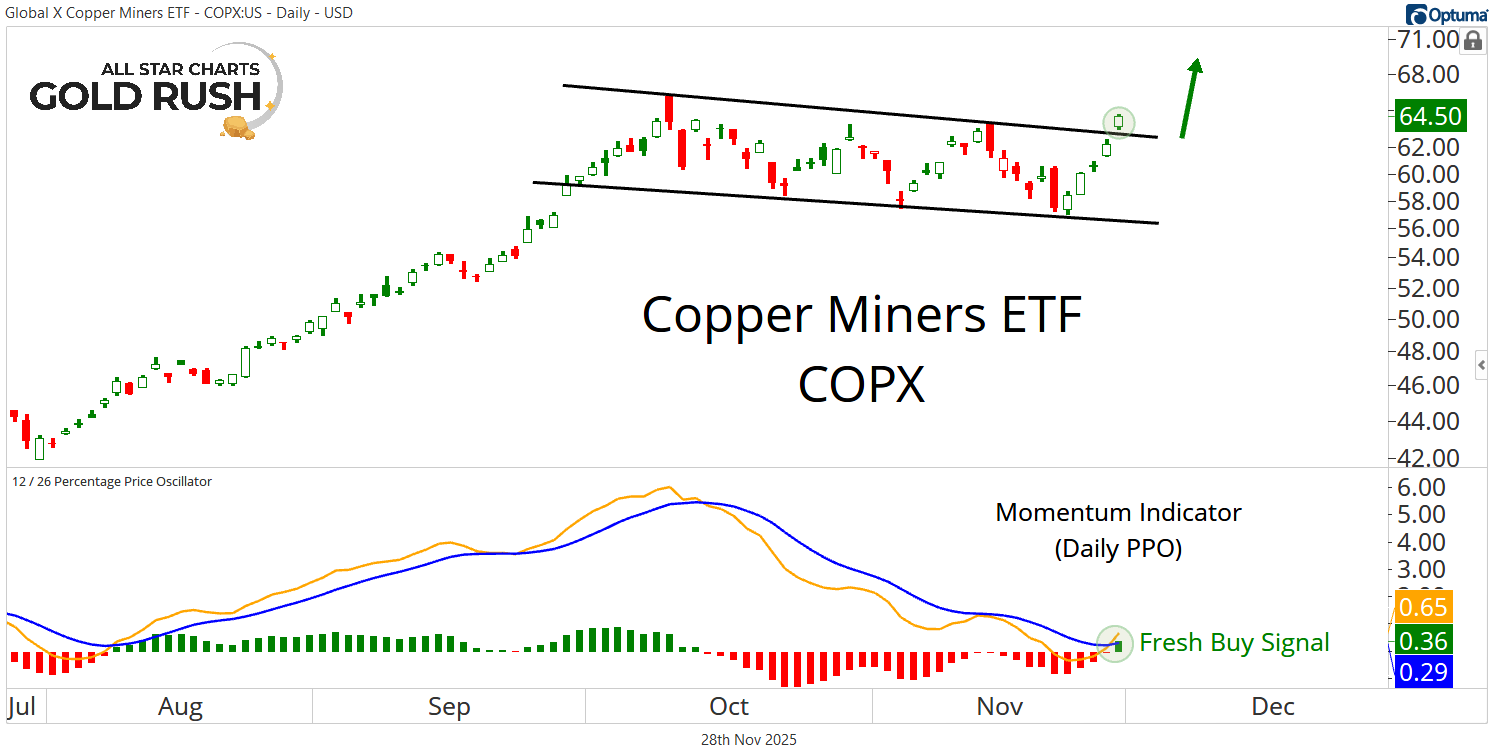
Since then, COPX has traded flat as a pancake beneath.
This is the exact type of high-and-tight consolidation you see in the strongest primary uptrends. As we say all the time, the best uptrends correct through time, not price.
Over the past few weeks, the price has worked off its overbought momentum with a textbook retest of the zero-line on the daily percentage price oscillator.
Then came Friday’s session...
The price made a gap-n-go move away from its consolidation right as the momentum indicator triggered a fresh buy signal.
This is the exact type of short-term confirmation we look for right as a structural breakout is taking hold.
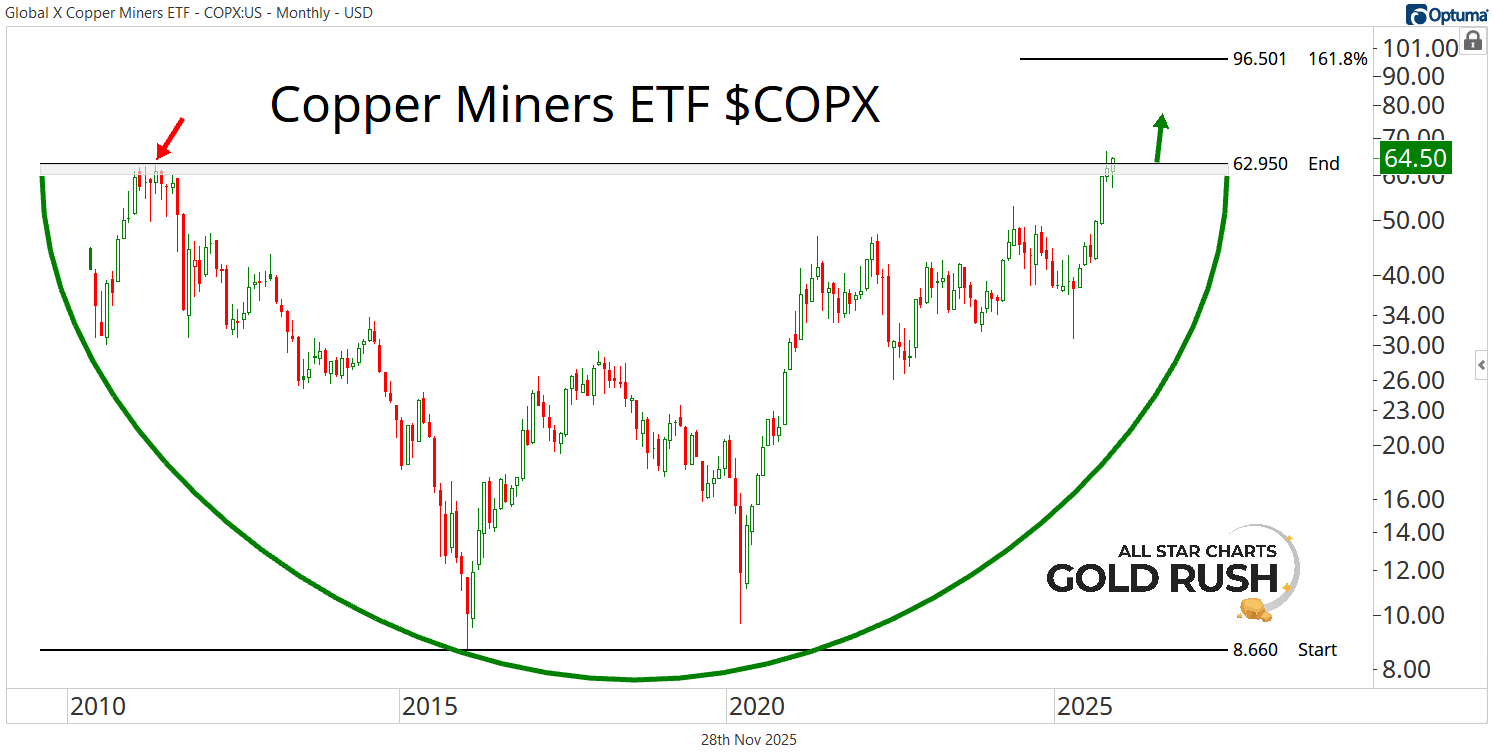
Which brings us to the real showstopper: the long-term COPX chart.
COPX has been forming a massive base since peaking in 2011. It has been fourteen years of nothing.
You don’t get patterns like this very often, and when they finally resolve, the moves are not modest. Charts like this kick off brand-new secular uptrends, as we've seen in precious metals recently.
Now that the price is decisively breaking above the 2011 highs, the path of least resistance is undoubtedly higher for the foreseeable future.
We want to own COPX above 63, with a target of 96.50 over the coming 3-6 months.
And if this isn't enough potential upside for you, check out the commodities trade of the week below. It's one of our favorite Copper miners in the world.