For over a year, I’ve been waiting for the yield curve to steepen. Not drift higher. Not wobble. But reverse — decisively — and start climbing again.
Now it’s finally happening.
And when the yield curve turns up in sync with the CRB Commodity Index, you’re not just looking at two charts. You’re looking at the macro engine of the global economy firing back to life.
Let’s walk through the two major signals that matter most right now:
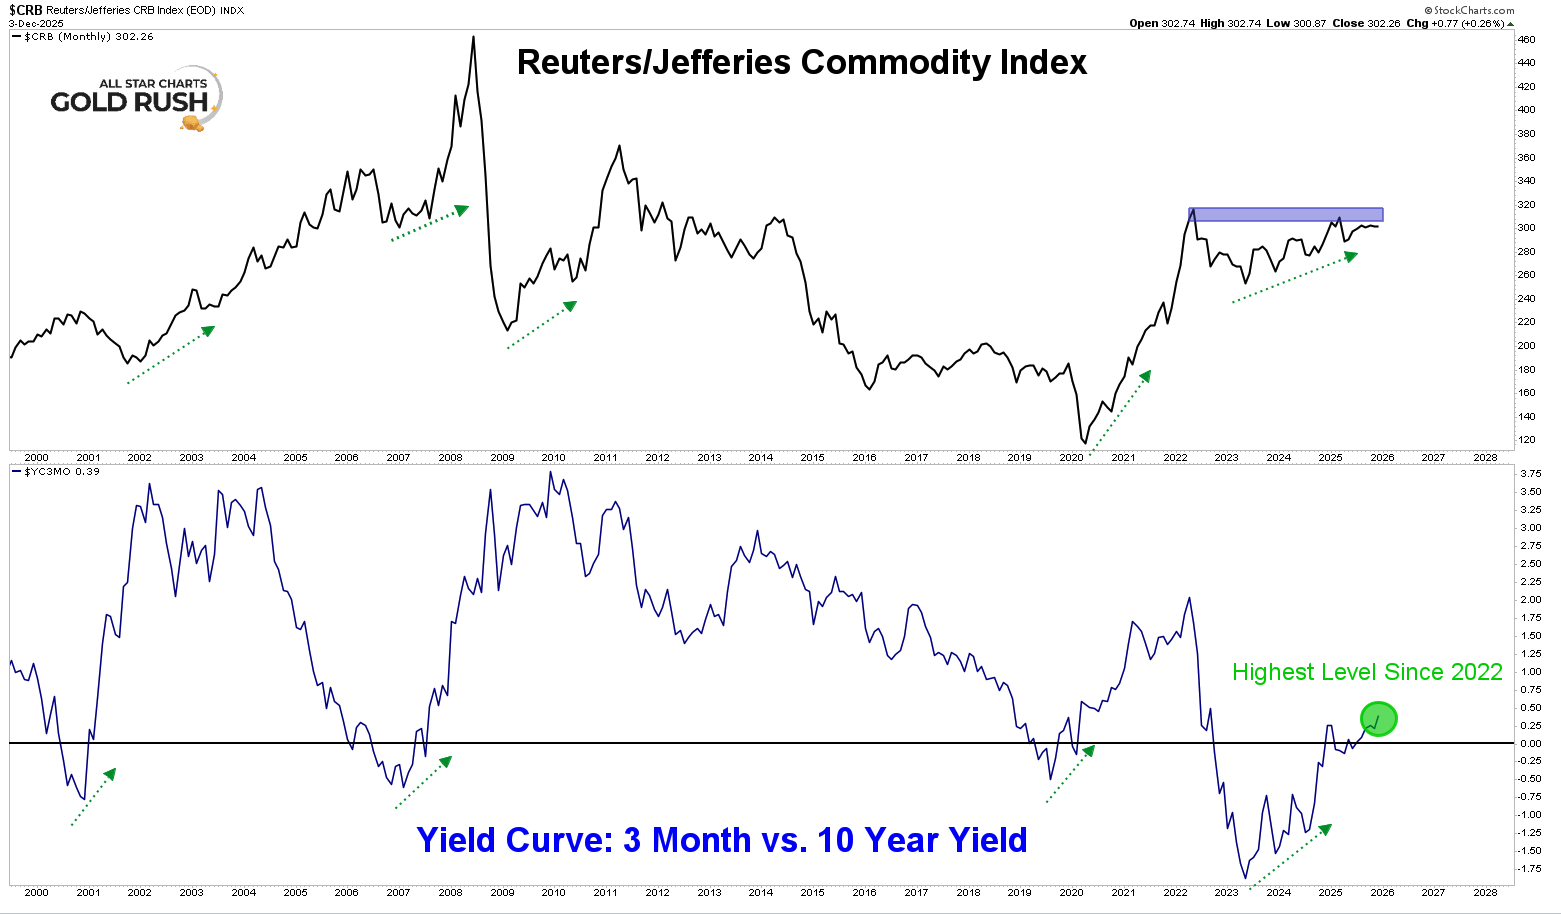
The Yield Curve + CRB Index chart
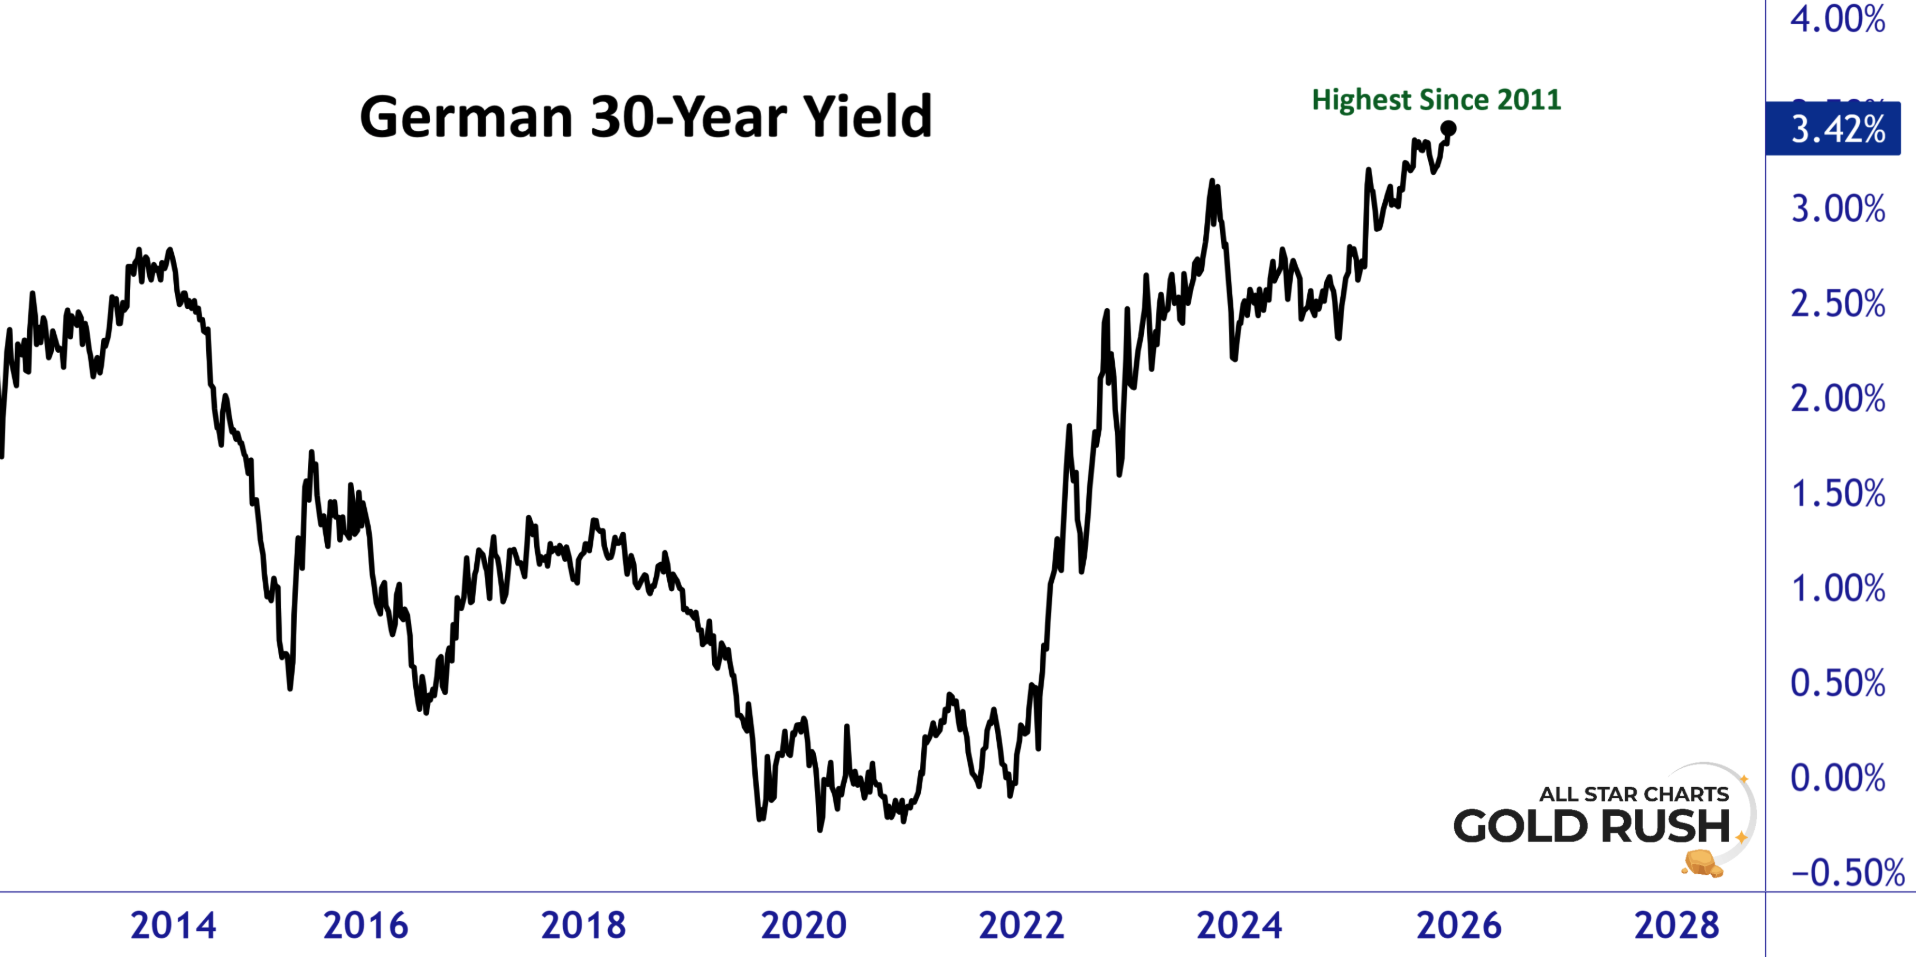
The German 30-Year Yield
These two combined tell the story of the next major commodity cycle better than any headline, economist, or forecast ever could.
The Yield Curve Steepening + The CRB Coiling: Two Sides of the Same Economic Story
This is the most important chart pairing in macro right now.
Start with the yield curve.
For nearly two years, it was deeply inverted — one of the strongest recessionary signals in the financial system. Short-term rates were above long-term rates, meaning the bond market was pricing caution, stress, and contraction.
But look at what’s happening now:
The curve has surged back toward positive territory.
It’s steepening at a fast pace .
It’s doing so with momentum — not noise.
This is called a bull steepening:
Short-term yields stabilize
Long-term yields rise
The curve slopes upward again
A bull steepener is historically associated with the beginning of expansion, not the end. It's the bond market saying:
“Global Growth is improving. Demand is strengthening. Inflation pressures are returning.”
Now look at the CRB Commodity Index, which sits directly above the yield curve on your chart.
For two years, the CRB has been consolidating under major resistance. Taking its time. Coiling. Building tension. Making higher lows with every dip.
The CRB doesn't break out when the global economy is slowing.
It breaks out when the global economy is re-accelerating.
And historically, the CRB begins to move right when the yield curve steepens.
This is why the combined chart is so powerful:
When the yield curve bottoms, commodities tend to bottom.
When the yield curve steepens, commodities begin trending.
When the yield curve steepens quickly, major commodity cycles emerge.
The two charts are telling the same story.
They are always linked.
The yield curve is the macro heartbeat.
The CRB is the market’s response.
And right now?
Both are turning.
Global Yields Are Rising — The German 30-Year Confirms the Reflation Cycle
The U.S. isn’t doing this alone.
Look at the German 30 year yield — the cleanest global long-term indicator we have.
It’s at its highest level since 2011
It’s in a clear structural uptrend
It’s confirming the same steepening dynamic we see in the U.S.
Global yields rising in unison is one of the most reliable signals of:
rising inflation expectations
stronger nominal growth
increased demand for real assets
the beginning of an expansionary cycle
In other words, this isn’t a U.S. reflation story.
It’s a global reflation story.
When both U.S. and European long-term yields rise together, commodity cycles tend to be stronger, broader, and longer-lasting.
The German 30-year is essentially saying:
“The world is preparing for higher prices.”
What This Means: Oil, Gasoline, Heating Oil, and the Entire Commodity Complex Are Next
Tie these two signals together:
Yield Curve + CRB turning at the same time
Global long-term yields rising
This is the setup for:
crude oil
gasoline
heating oil
distillates
industrial metals
agriculture
energy equities
to begin their next major move.
Energy markets don’t explode randomly. They move when the macro aligns.
And right now, the macro is lining up perfectly:
The yield curve steepened
The CRB is coiled under resistance
Global yields are rising
The dollar is softening
Everything here is early-cycle behavior.
This is the point in the cycle where the frustrating chop ends and the trending environment begins.
The Bottom Line: This Is the Beginning of a Major Commodity Wave
These two charts — the Yield Curve + CRB, and the German 30 Year Yield — are the entire macro sequence in two clean pictures.
They tell the same story:
The global economy is transitioning from contraction fear to expansion reality.
And energy commodities are the beneficiaries of that shift.
Oil is ready.
Gasoline is ready.
Heating oil is ready.
The CRB is ready.
We’ve been waiting for the steepening.
Now it’s here.
And the move that follows is almost always powerful.