Just a quick programming note. The US Markets are closed today for a national day of mourning, after the passing former US President Jimmy Carter.
We'll be back to our regularly scheduled program tomorrow and every weekday after that. Make sure to save this link as a favorite to join us 8:30-10AM ET daily on The Best Morning Show in Finance.
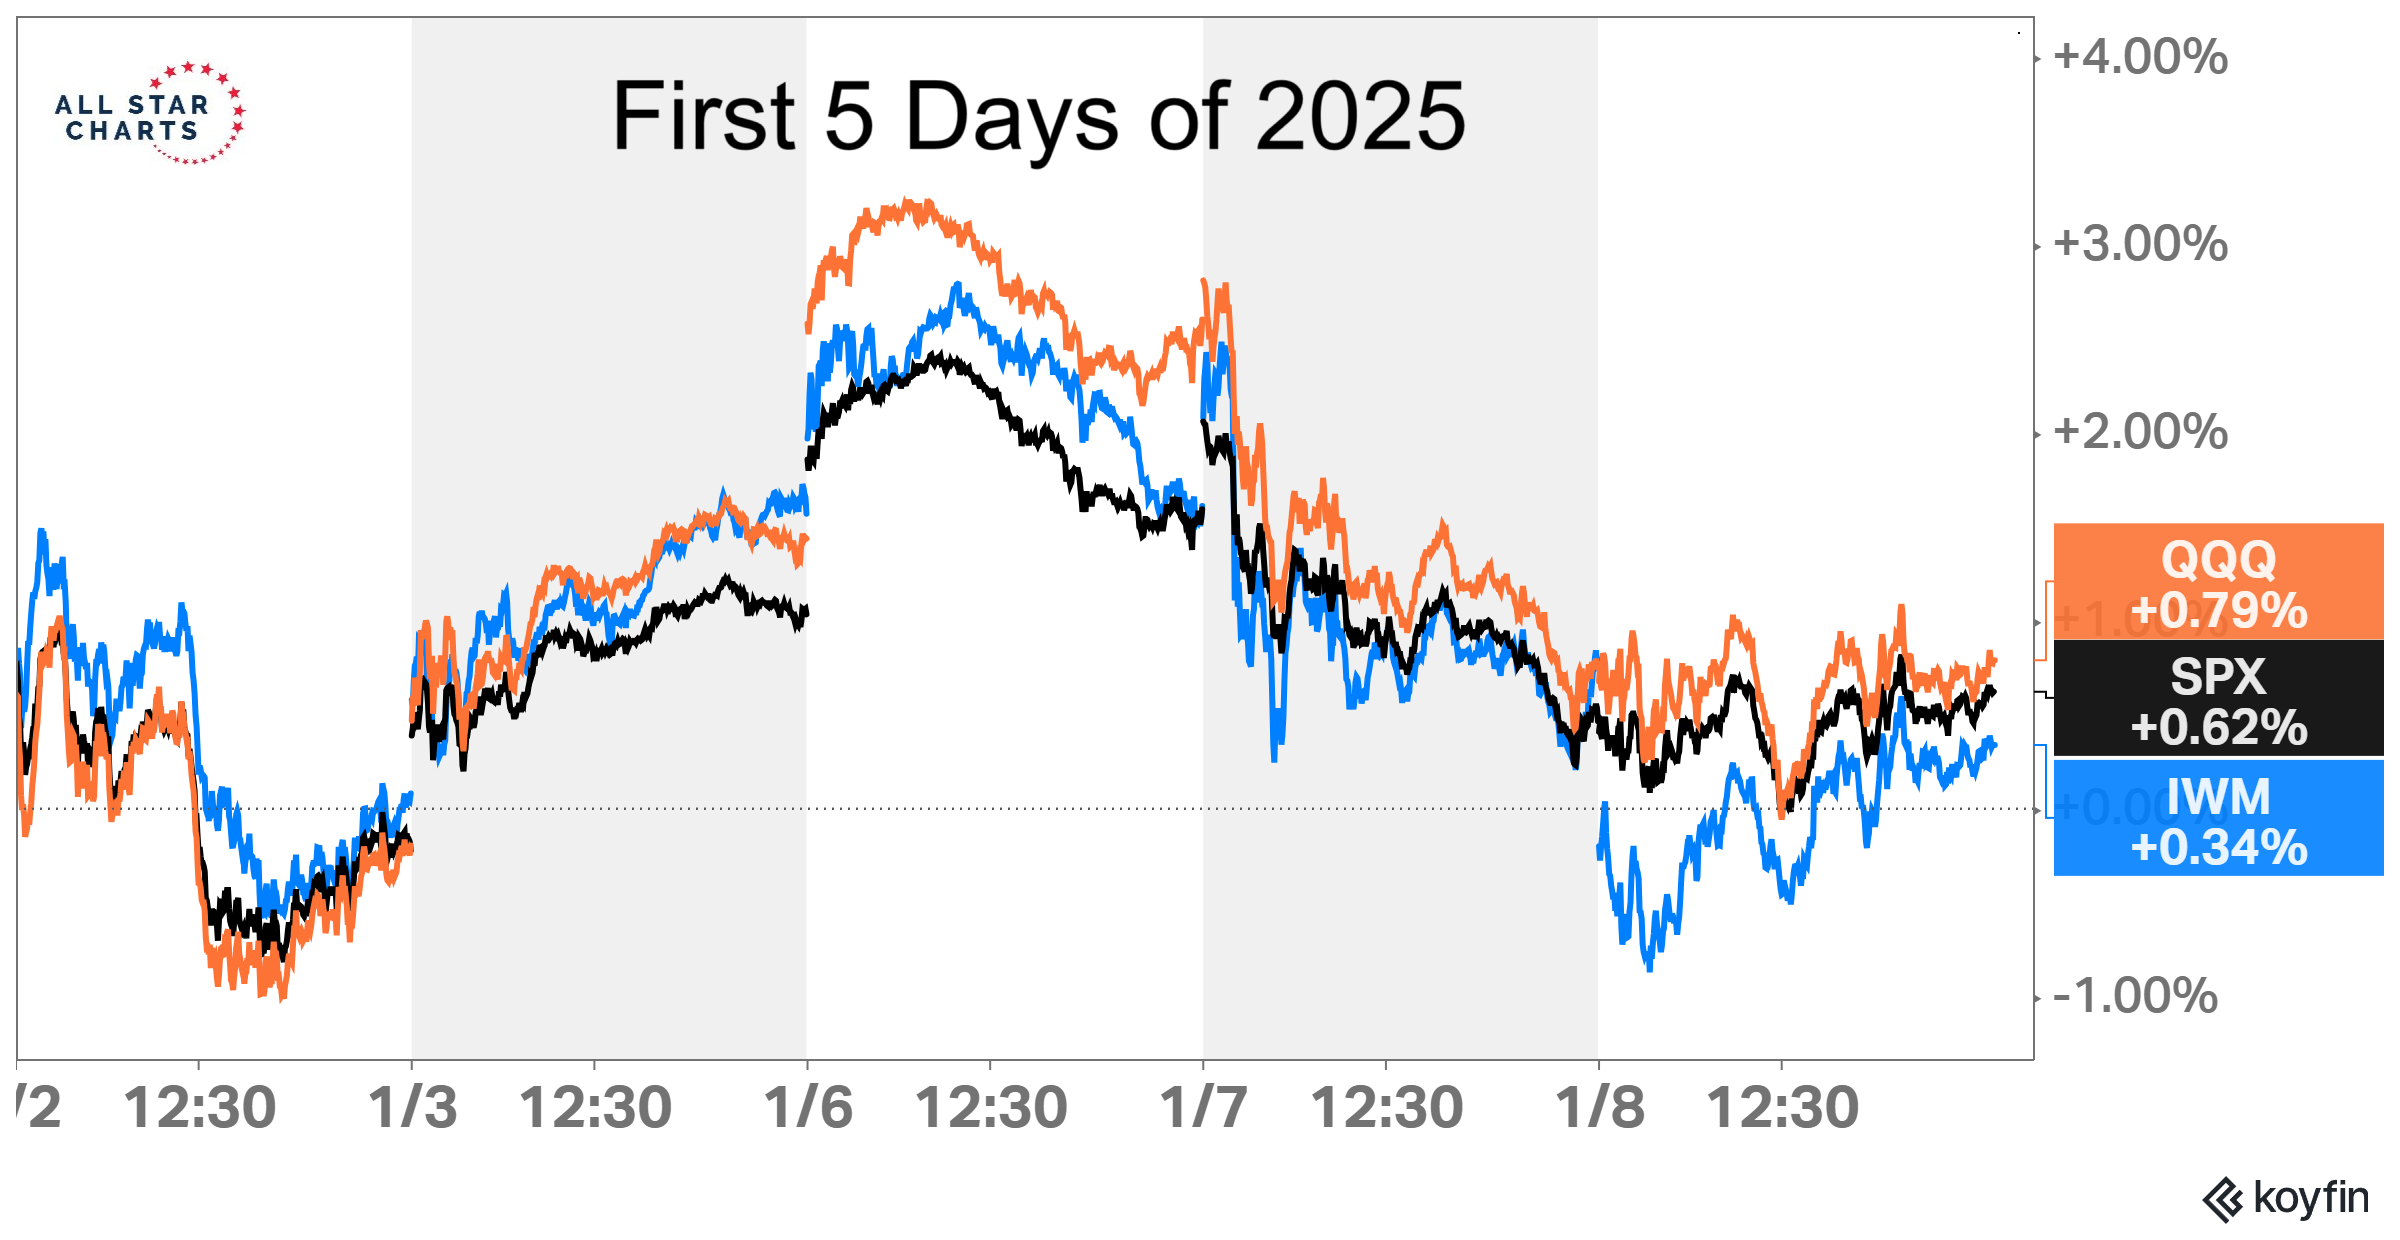
First 5 Days Indicator
The S&P500 is less than 3% away from making new all-time highs, but investors are losing their minds.
You notice how everyone is now a "breadth expert"? One by one, they're all out there mansplaining breadth deterioration to anyone who will listen.
The odd thing about these johnny-come-lately breadth "experts", is that none of them include sector rotation into their weak attempts at describing the current market breadth.
Sector Rotation is the lifeblood of a bull market. You see Airlines? You see Medical Devices? How about the new all-time lows for Consumer Staples relative to S&Ps?
Sector rotation IS market breadth. To ignore this rotation in favor of some arbitrary calculation of the weighting of the top 10 stocks in one index is foolish.
Trust me, I know. I used to do stupid shit like that too when I was a lot younger.
Anyway, the market is closed today, but not before it completed the first 5 days of the new year.
This is the 2nd big indicator of the now-famous January Trifecta, which includes the Santa Claus Rally, First 5 days, and the January Barometer.
The S&P500 and other large-cap indexes did NOT rally during this year's Santa Claus Rally period. Small-caps and Micro-cap Indexes did.
So mixed results there.
The First 5 Days Indicator, however, was in fact positive. According to the Stock Trader's Almanac, the last 48 up First Five Days were followed by full-year gains 40 times, for an 83.3% accuracy ratio and a 14.2% average gain in all 48 years.
The market has a great track record of performance after the first 5 days of the year are positive. But in my experience, and also according to Jeff Hirsch, editor of the Stock Trader's Almanac, it's the January Barometer that is the most powerful of the Trifecta.
"As January goes, so goes the rest of the Year", is how I learned it.
But more importantly than all of these seasonal studies, it's the sector rotation and the actual breadth of the market. And when I say breadth, I'm not talking about these silly superlatives they share on the internet to try and boost their page views. We don't write glorified gossip columns here, nor are we whoring ourselves out on twitter looking for attention. Facts only around here.
It's the sector rotation and the broad participation that I'm most interested in. And at this point, it's really the lack of stocks going down that really stands out the most. If there is going to be a correction, expect to see an expansion in the number of stocks that are actually going down in price. So far, this has yet to happen.
Also, look for the defensive Consumer Staples to show some signs of life, if markets are going to correct. We haven't seen that at all. Just new relative lows week after week.
This week, we all got together, took a step back and zoomed out on markets to really understand where we are in the current cycle.
The macro perspective, the new trade ideas, and the roadmap for the rest of Q1 were all laid out. You can catch the replay, download all the charts and review each new trade here RISK FREE.
Find out why many of the best performing financial institutions in the world keep coming to All Star Charts for help navigating the markets. We're honored, and we certainly do not take this responsibility lightly.