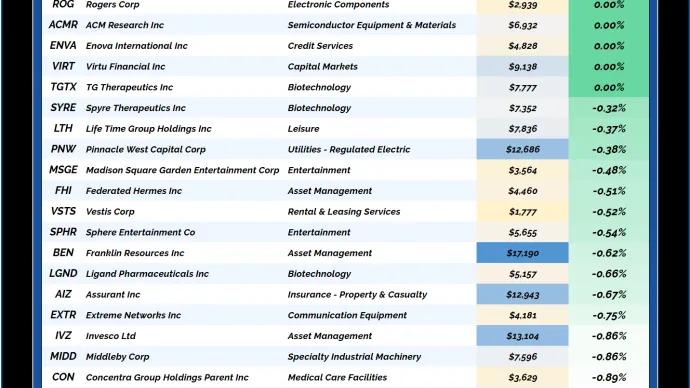
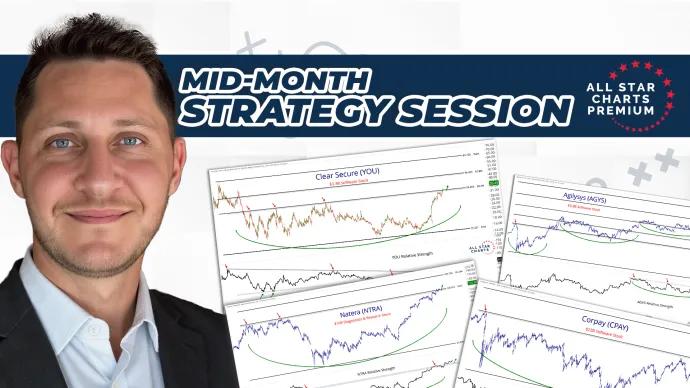
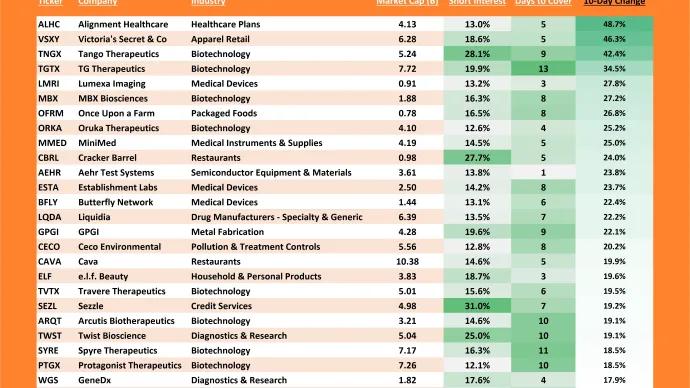
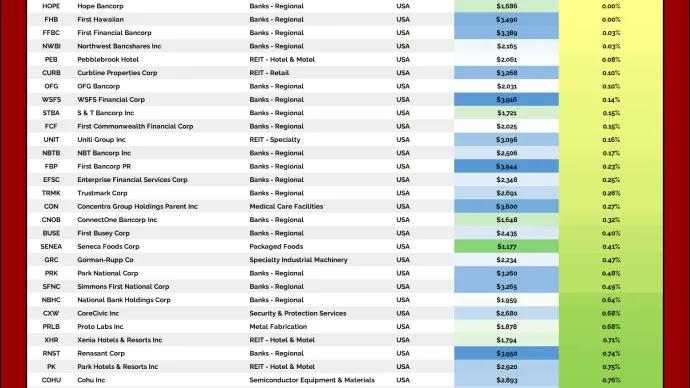
Everything you need to know about price action, regardless of asset class. We analyze stocks, bonds, currencies, and commodities based on supply and demand, momentum and trend.
We've had some great trades come out of this small-cap-focused column since we launched it back in 2020 and started rotating it with our flagship bottom-up scan, Under the Hood.
For the first year or so, we focused only on Russell 2000 stocks with a market cap between $1 and $2B.
That was fun, but we wanted to branch out a bit and allow some new stocks to find their way onto our list.
We expanded our universe to include some mid-caps.
Nowadays, to make the cut for our Minor Leaguers list, a company must have a market cap between $1 and $4B.
And it doesn't have to be a Russell component — it can be any US-listed equity. With participation expanding around the globe, we want all those ADRs in our universe.
The same price and liquidity filters are applied. Then, as always, we sort by proximity to new...
Why? Because tariffs create immediate uncertainty. They slow growth, tighten financial conditions, and drive a flight to safety — all of which are bond bullish in the short term. We’ve seen this playbook before: geopolitical tension or trade stress leads to a bid for duration.
The chart’s not there yet — but it’s starting to shape up. Bonds still have work to do before we can talk new 52-week highs. For $TLT, that means clearing this massive base and getting above 100.40 with some momentum behind it. That’s the line in the sand. Get through that, and the squeeze could start to build.
But here’s the catch — the long-term impact is different.
Tariffs raise input costs. They squeeze supply chains. And they don’t reduce demand — they just make things more expensive. Over time, that feeds into inflation. So while bonds may catch a near-term bid on fears of economic slowdown, the structural risk is higher inflation down the road.
It’s the classic setup: short-term deflationary shock, long-term inflationary shift.
So yes — bonds could break out. But if this pressure...
I'm in Miami this week, where I grew up, visiting family and I'm feeling nostalgic.
So I wanted to share a chart that I've kept with me for a long long time. I even used the same Stockcharts.com chart, that I originally annotated a handful of cycles ago, so you can see just how long I've had this one with me.
We're looking at the percentage of stocks on the NYSE that are above their 200 day moving average.
The idea here is that we are NOT interested in buying the indexes on their way down below 20% of constituents above their 200 day.
The goal during these times is to buy them on the way back up.
I've been having this debate with some of the world's top portfolio managers and strategists for over the past 2 decades.
Some of these arguments have even gotten pretty heated throughout these cycles. I remember one private back and forth during the late 2018 period where the strategist was pounding the table about the 20% level, while I was much more focused on the 15% mark.
On Wednesday, the United States announced new tariffs against dozens of countries. This set off a wave of selling pressure, which appears to have no end in sight.
Our Hall of Famers list is composed of the 150 largest US-based stocks.
These stocks range from the mega-cap growth behemoths like Apple and Microsoft – with market caps in excess of $2T – to some of the new-age large-cap disruptors such as Moderna, Square, and Snap.
It has all the big names and more.
It doesn’t include ADRs or any stock not domiciled in the US. But don’t worry; we developed a separate universe for that. Click here to check it out.
The Hall of Famers is simple.
We take our list of 150 names and then apply our technical filters so the strongest stocks with the most momentum rise to the top.
Let’s dive right in and check out what these big boys are up to.
Here’s this week’s list:
*Click table to enlarge view
We filter out any laggards that are down -5% or more relative to the S&P 500 over the trailing month.
What's not selling off as much as you'd think it would be?
These are the types of questions I like to ask during environments like this.
I've seen this many times before. I can tell you that the assets showing relative strength in this market will likely be the leaders during the next recovery.
In the meantime, below overhead supply is still the key theme right now, particularly for U.S. equities.
It has been since the Dow and S&P500 lost their key levels and were unable to reclaim them. Remember the Nasdaq100...
We love our bottoms-up scans here at All Star Charts. We tend to get really creative when making new universes as we want to be sure they will deliver us the best opportunities the market has to offer.
However, when it comes to this one, it couldn't be any simpler!
With the goal of finding more bullish setups, we have decided to expand one of our favorite scans and broaden our regular coverage of the largest US stocks.
Welcome to TheJunior Hall of Famers.
This scan is composed of the next 150 largest stocks by market cap, those that come after the top 150 and are thus covered by the Hall of Famers universe. Many of these names will someday graduate and join our original Hall Of Famers list. The idea here is to catch these big trends as early on as possible.
There is no need to overcomplicate things. Market cap is a quality filter at the end of the day. It only grows if price is rising. That's good enough for us.
In this scan, we look to identify the strongest growth stocks as they climb the market-cap ladder from small- to mid- to large- and, ultimately, to mega cap status (over $200B).
Once they graduate from small-cap to mid-cap status (over $2B), they come on our radar. Likewise, when they surpass the roughly $30B mark, they roll off our list.
But the scan doesn't just end there.
We only want to look at the strongest growth industries in the market, as that is typically where these potential 50-baggers come from.
Some of the best performers in recent decades – stocks like Priceline, Amazon, Netflix, Salesforce, and myriad others – would have been on this list at some point during their journey to becoming the market behemoths they are today.
When you look at the stocks in our table, you'll notice we're only focused on Technology and Growth industry groups such as Software, Semiconductors, Online...