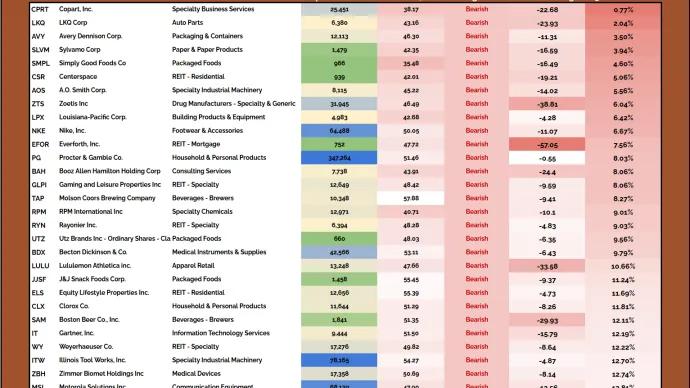
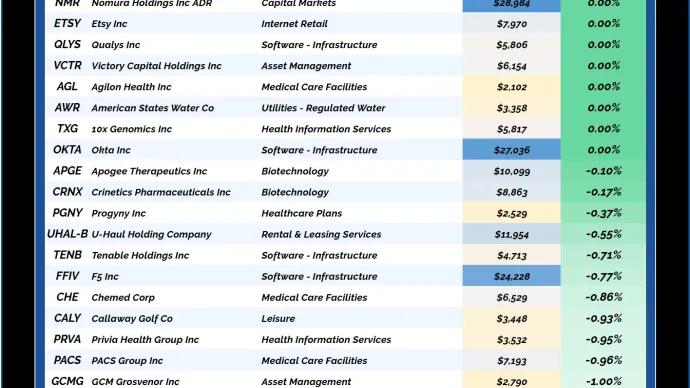
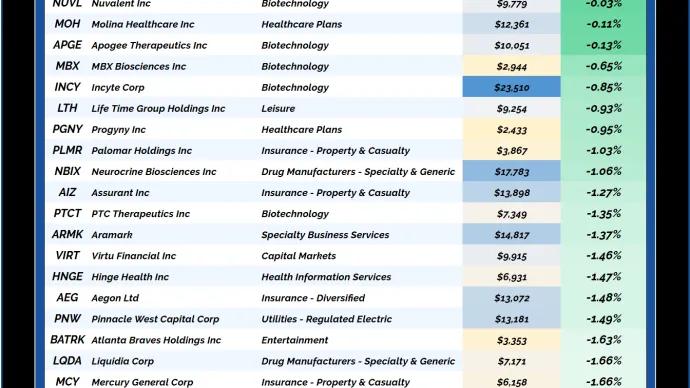
Steve Strazza The Short Report From the Desk of Steve Strazza @SstrazzaWhen investing in the stock market, we always want to approach it as "a market of stocks."Regardless of the environment, there are always stocks showing... July 21, 2026 All Star Charts Premium Short Report ASC Premium Members Only
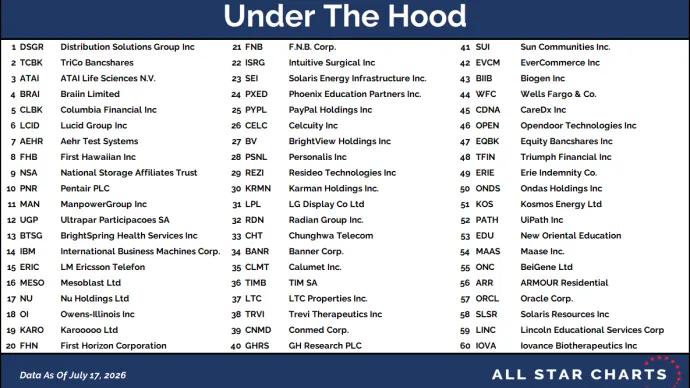
Steve Strazza Under The Hood From the Desk of Steve Strazza @Sstrazza.Welcome back to Under the Hood, where we'll cover all the... July 20, 2026 All Star Charts Premium ASC Under The Hood Stocks Steve Strazza Premium Members Only
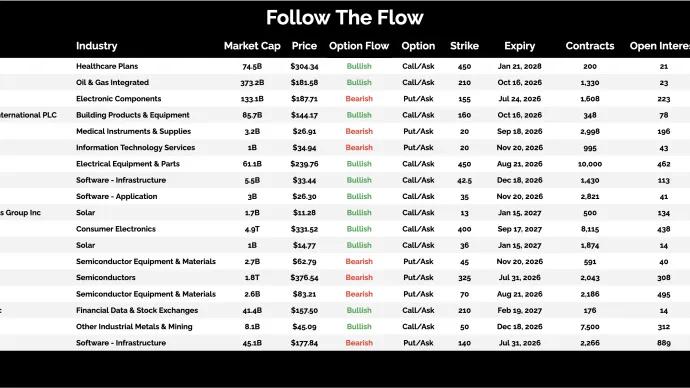
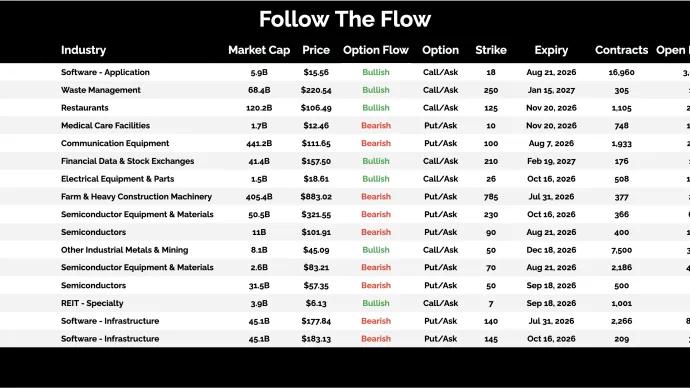
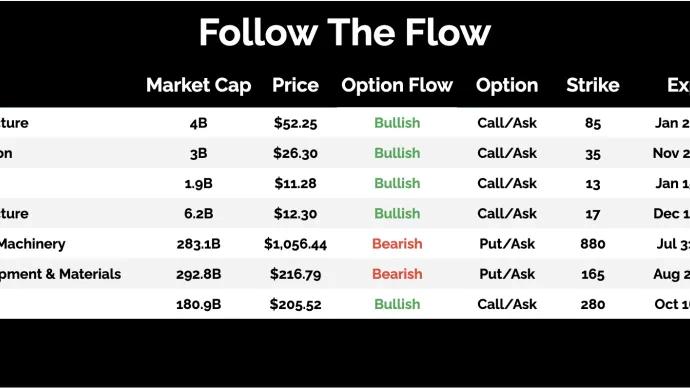
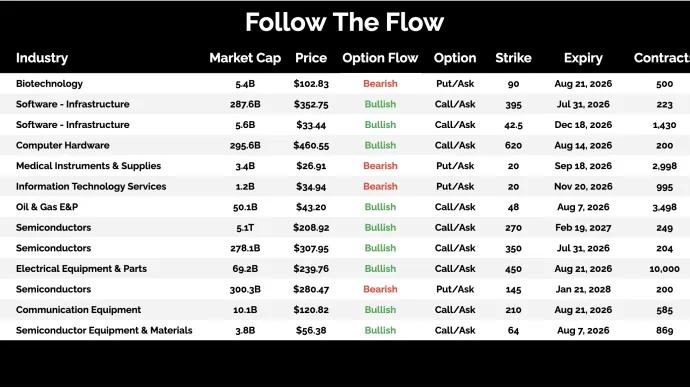
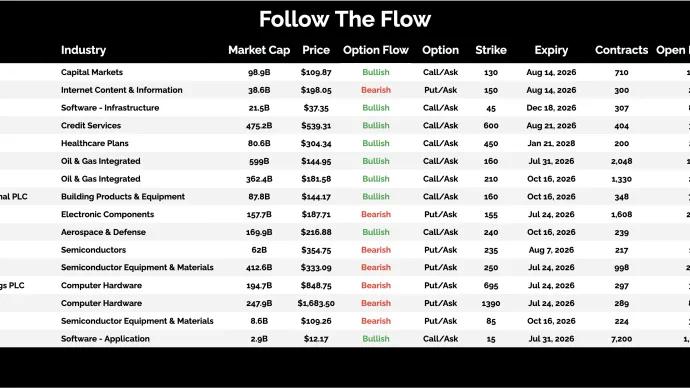
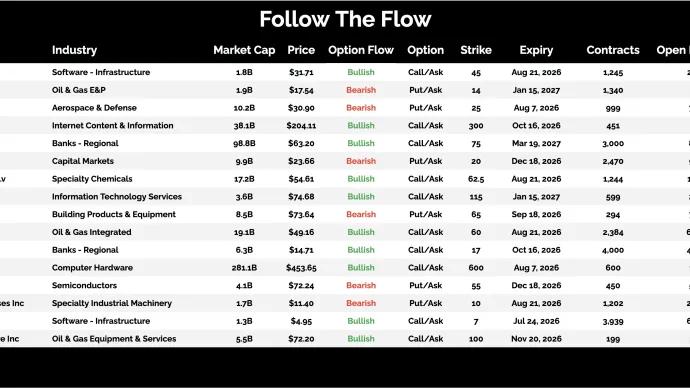
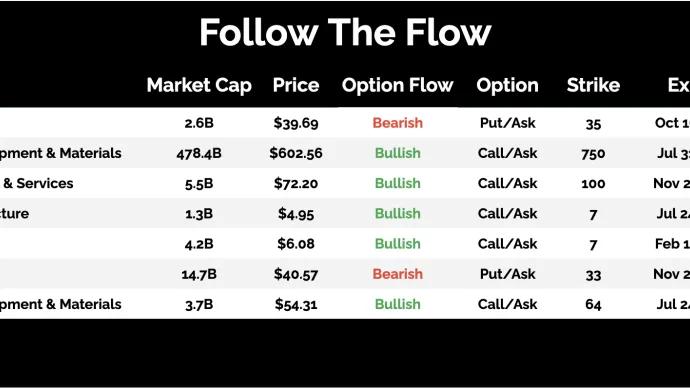
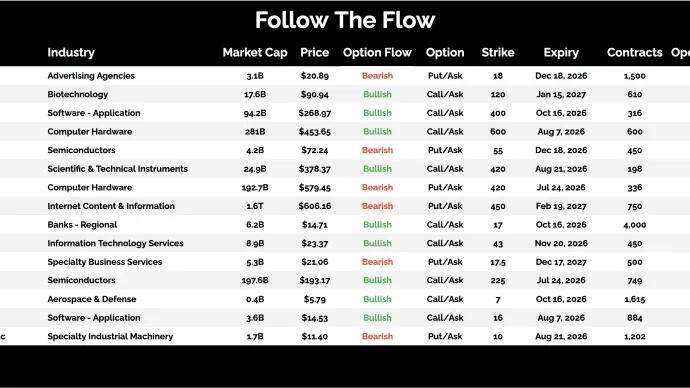
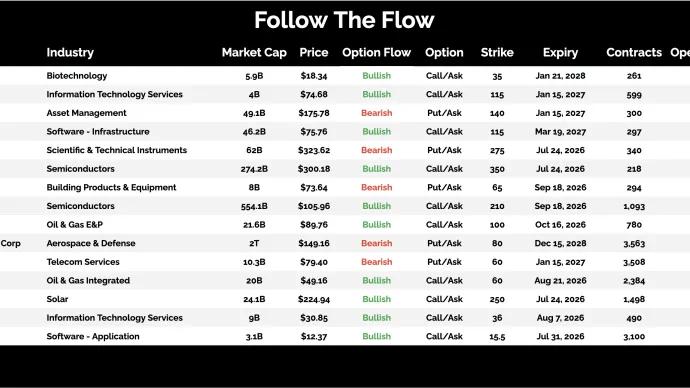
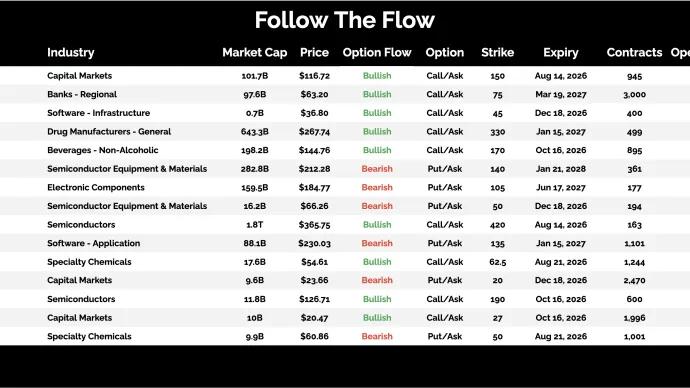
Steve Strazza Follow the Flow Every weekend I dig through the names that experienced the most interesting unusual options activity. We’re looking for trades that stood out, whether it was large in size or a very aggressive strike selection.... July 19, 2026 All Star Charts Premium ASC Follow The Flow Steve Strazza Members Only
Steve Strazza Top Down Trade of the Week Refiners lead the rebound in energy stocks Welcome back for another Top Down Trade of the Week.This is a classic leadership scan.We start with the best sectors, then drill into the subgroups. We pick one, and then take a look at... July 18, 2026 All Star Charts Premium Strazza ASC Premium Stocks Top Down Trade Of The Week Members Only
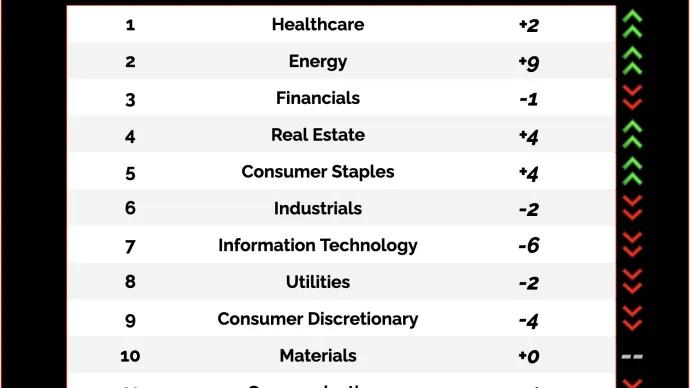
Saturday Morning Chartoons: Broadening Participation & Seasonal Tailwinds July 18, 2026 All Star Charts Premium Chartoons Members Only
Steve Strazza The Daily Flow Is the market warming back up to clean energy, coffee, and rideshare all at once? This note highlights a select group of stocks showing the most unusual — and highly directional — options activity.The goal is simple: follow the big money and trade in the direction of the underlying... July 17, 2026 All Star Charts Premium ASC Follow The Flow Steve Strazza
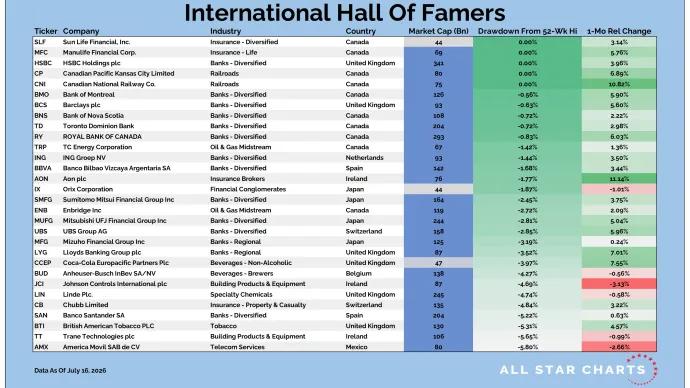
Steve Strazza International Hall of Famers From the desk of Steve Strazza @SstrazzaOur International Hall of Famers list is composed of the 100 largest US-listed international stocks, or ADRs.We've also sprinkled in some of the largest ADRs... July 17, 2026 All Star Charts Premium Strazza Stocks Premium ASC International Hall Of Famers Members Only
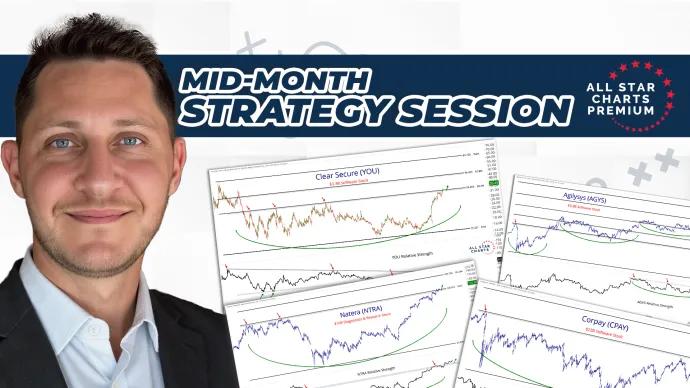
Steve Strazza Alfonso De Pablos, CMT [Premium] Mid-Month Strategy Session - July 2026 July 17, 2026 All Star Charts Premium Conference Call Members Only
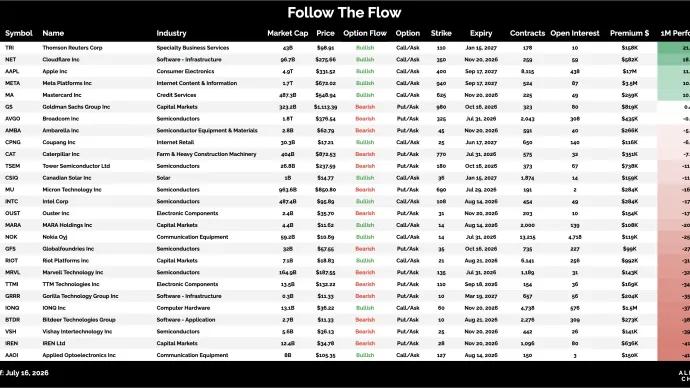
Steve Strazza The Daily Flow Did you catch the flow in beaten solar, a semi giant getting sold, and the biggest premium on the whole board? This note highlights a select group of stocks showing the most unusual — and highly directional — options activity.The goal is simple: follow the big money and trade in the direction of the underlying... July 16, 2026 All Star Charts Premium ASC Follow The Flow Steve Strazza
Sam Gatlin Junior Hall of Famers From the Desk of Sam Gatlin @sam_gatlinWe love our bottoms-up scans here at All Star Charts. We tend to get really creative when making new universes as we want to be sure they will deliver us the best opportunities the market has to... July 16, 2026 All Star Charts Premium Stocks Sam Gatlin Junior Hall Of Famers Members Only
Steve Strazza The Daily Flow Where is the money leaning as payments, app software, and solar all light up green? This note highlights a select group of stocks showing the most unusual — and highly directional — options activity.The goal is simple: follow the big money and trade in the direction of the underlying... July 15, 2026 All Star Charts Premium ASC Follow The Flow Steve Strazza
Ricardo Sarraf 2 to 100 Club From the desk of Ricardo Sarraf @nullchartsEvery cycle produces a handful of stocks that go from emerging to enormous — names that compound 10x, 20x, 50x before they become portfolio fixtures. But they... July 15, 2026 2 to 100 Club All Star Charts Premium 2-to-100 Club Premium ASC Stocks Ricardo Sarraf Members Only
Steve Strazza The Daily Flow Why is real paper landing in a small-cap software name, an energy laggard, and a beaten-down optical play? This note highlights a select group of stocks showing the most unusual — and highly directional — options activity.The goal is simple: follow the big money and trade in the direction of the underlying... July 14, 2026 All Star Charts Premium ASC Follow The Flow Steve Strazza
Steve Strazza The Daily Flow Big oil call buying stacking up while a software name draws size This note highlights a select group of stocks showing the most unusual — and highly directional — options activity.The goal is simple: follow the big money and trade in the direction of the underlying... July 13, 2026 All Star Charts Premium ASC Follow The Flow Steve Strazza
Steve Strazza The Minor Leaguers From the Desk of Steve Strazza @SstrazzaWelcome to The Minor Leaguers.We've had some great trades come out of this small-cap-focused column since we launched it back in 2020 and... July 13, 2026 All Star Charts Premium Minor Leaguers ASC Stocks Steve Strazza Premium Small Caps Members Only
Steve Strazza Follow the Flow Every weekend I dig through the names that experienced the most interesting unusual options activity. We’re looking for trades that stood out, whether it was large in size or a very aggressive strike selection.... July 12, 2026 All Star Charts Premium ASC Follow The Flow Steve Strazza Members Only
Steve Strazza Top Down Trade of the Week This train is on track for new highs Welcome back for another Top Down Trade of the Week.This is a classic leadership scan.We start with the best sectors, then drill into the subgroups. We pick one, and then take a look at... July 11, 2026 All Star Charts Premium Strazza ASC Premium Stocks Top Down Trade Of The Week Members Only
Saturday Morning Chartoons: Semiconductors at the Crossroads July 11, 2026 All Star Charts Premium Chartoons Members Only
Steve Strazza The Daily Flow New money in old sectors, and three names getting positioned before the crowd catches on This note highlights a select group of stocks showing the most unusual — and highly directional — options activity.The goal is simple: follow the big money and trade in the direction of the underlying... July 10, 2026 All Star Charts Premium ASC Follow The Flow Steve Strazza
Steve Strazza The Hall of Famers From the desk of Steve Strazza @SstrazzaOur Hall of Famers list is composed of the 150 largest US-based stocks.These stocks range from the mega-cap growth behemoths like Apple and Microsoft – with... July 10, 2026 All Star Charts Premium Stocks Hall Of Famers ASC Premium Strazza Members Only
Steve Strazza The Daily Flow One breakout in hardware, one base flipping bullish in software, one regional bank coiling for the next leg This note highlights a select group of stocks showing the most unusual — and highly directional — options activity.The goal is simple: follow the big money and trade in the direction of the underlying... July 9, 2026 All Star Charts Premium ASC Follow The Flow Steve Strazza
Steve Strazza The Daily Flow Down a lot, up a lot, and priced for a bounce nobody's watching This note highlights a select group of stocks showing the most unusual — and highly directional — options activity.The goal is simple: follow the big money and trade in the direction of the underlying... July 8, 2026 All Star Charts Premium ASC Follow The Flow Steve Strazza
Ricardo Sarraf 2 to 100 Club From the desk of Ricardo Sarraf @nullchartsEvery cycle produces a handful of stocks that go from emerging to enormous — names that compound 10x, 20x, 50x before they become portfolio fixtures. But they... July 8, 2026 2 to 100 Club All Star Charts Premium 2-to-100 Club Premium ASC Stocks Ricardo Sarraf Members Only
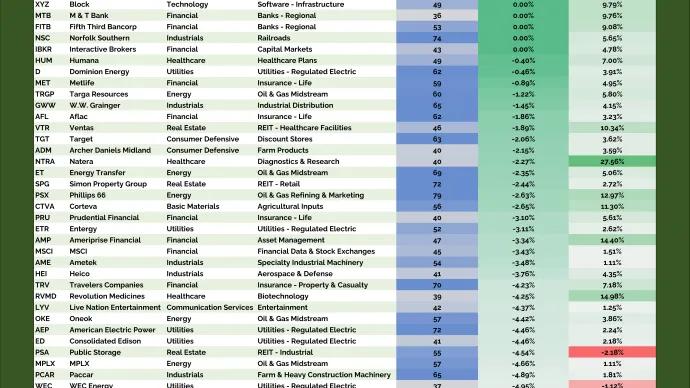
Steve Strazza The Daily Flow A half-million in bank calls, a broker already up 30%, and a materials name getting hit with downside bets This note highlights a select group of stocks showing the most unusual — and highly directional — options activity.The goal is simple: follow the big money and trade in the direction of the underlying... July 7, 2026 All Star Charts Premium ASC Follow The Flow Steve Strazza