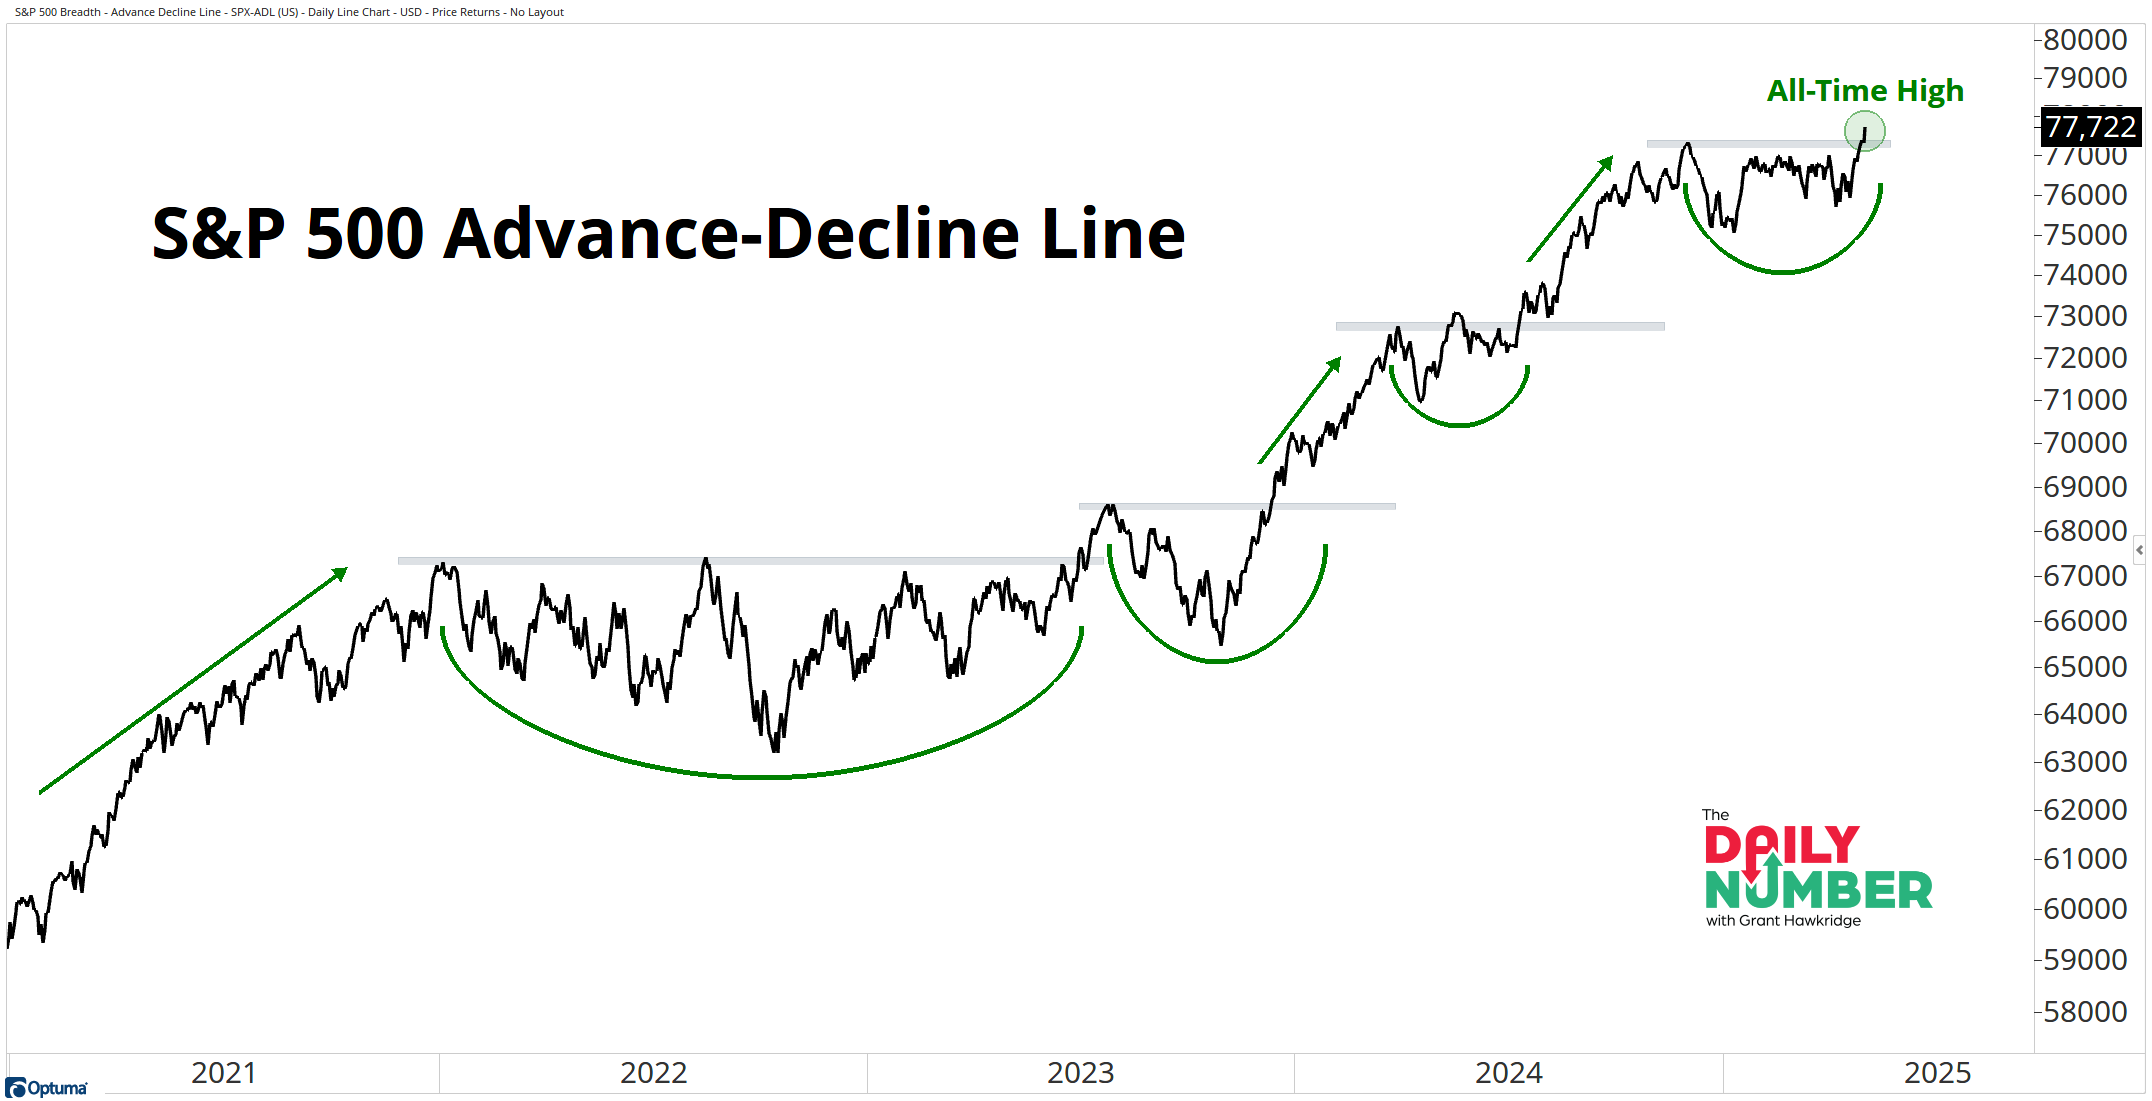
After 5 months of consolidating, the S&P 500 Advance-Decline line has closed at an all-time high.
Here’s the chart:
Let's break down what the chart shows:
The black line represents the S&P 500’s Advance-Decline line.
The Takeaway: The Advance-Decline Line is one of the purest ways to analyze market breadth to assess overall market strength.
It measures the number of stocks participating or not.
The concept is super simple.
We add the number of stocks moving higher and subtract the number of stocks that are declining. Then, we add that sum to the previous day's Advance-Decline Line value.
When the Advance-Decline Line rises, it indicates broad market participation. Conversely, when it falls, this suggests that more stocks are declining than advancing, which is a sign of market weakness.
Currently, the S&P 500 Advance-Decline Line is at its highest level ever, which indicates that market internals are strong.
This type of strength supports the potential for a sustainable rally moving forward.
As long as strong market internals continue, it becomes increasingly likely that the market has seen its bottom for this cycle.
Grant Hawkridge | Chief Aussie Operator, All Star Charts
ICYMI: Kenny Glick opened his Hit The Bid trading room up to the public for free. Kenny's sale ended but you can still call Mary at 323-421-7910 or email her at [email protected] to get his 15% discount.
If you find my content valuable, I would greatly appreciate it if you could share it with your friends, family, and colleagues. Your help in spreading the word is invaluable in supporting our work. Thank you to all of you who share!