Bond yields are breaking out as onshore drillers take the lead.
By Sam Gatlin, Jason Perz
May 15, 2026
There are easier jobs in Washington than running the Federal Reserve.
Jerome Powell inherited the chairmanship near the end of one cycle, navigated the fastest economic shutdown in modern history, watched the most aggressive monetary and fiscal experiment of our lifetimes unfold in real time, and then spent the back half of his tenure fighting the inflation that followed.
Now, on his final day as chairman of the Federal Reserve, the bond market is delivering one last message.
They look like figures from another world. Then, slowly, the pictures turn color, featuring Alan Greenspan, Ben Bernanke, Janet Yellen, and Jerome Powell.
Every one of these chairs served during eras, faced different crises, and made different mistakes.
But the job has always been the same: keep the system together without letting inflation tear it apart.
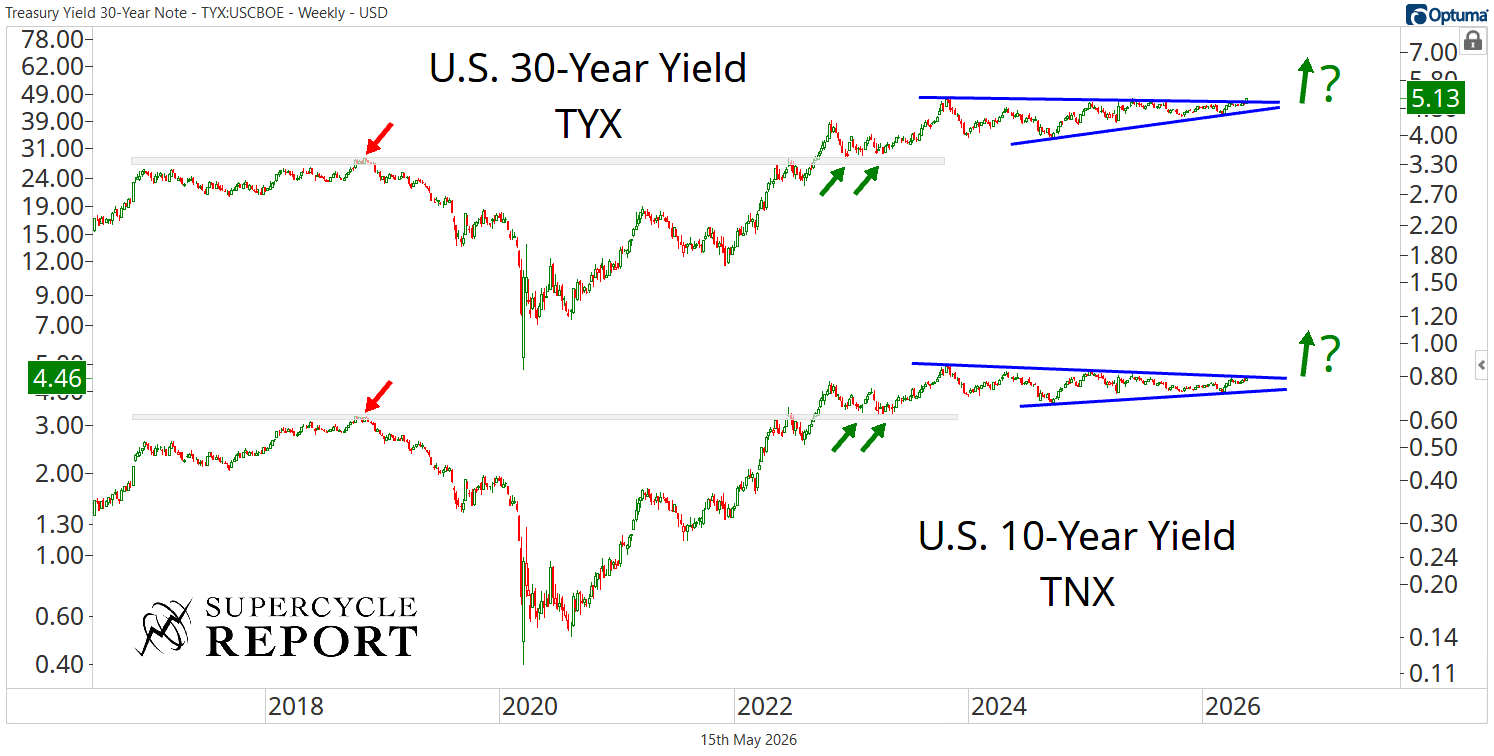
Powell’s chapter ends with the long end of the curve threatening to make one of the most important statements of his entire tenure.
The U.S. 30-year yield closed this week at its highest level since 2007, finally eclipsing the late-2023 peak that capped rates for years.
Over the past few years, the U.S. 30-year yield has been coiling up its next big move.
And the next leg higher is beginning right here, right now.
What's more, the U.S. 10-year yield is not far behind. We expect it to follow the 30-year yield higher.
The bond market is not buying the dovish narrative being shilled by Kevin Warsh.
And that matters because inflation is not dead, policy isn't tight enough, and if long-term yields continue to break higher from here, the market will do much of the tightening on its own.
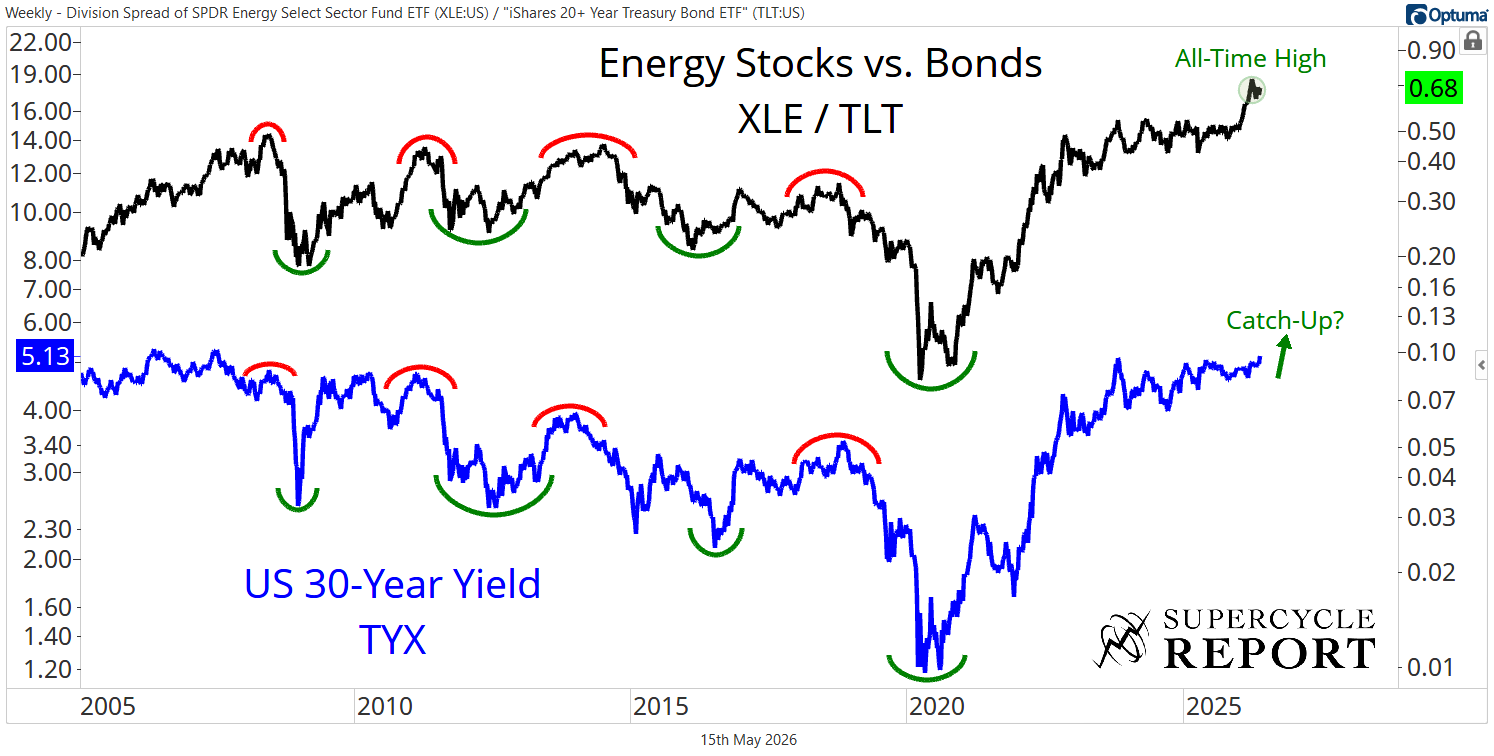
This shouldn't come as a surprise to anyone following our work here at the Supercycle Report, because for months, we’ve been pointing to one of the most important intermarket ratios in the market.
That is energy stocks relative to bonds overlayed with the U.S. 30-year yield. This intermarket chart is why we told our members to short bonds a month ago, and it's also why the trade has been working out so well for us.
XLE has already broken out to new all-time highs relative to TLT.
And historically, this ratio has moved closely in line with the U.S. 30-year yield, which makes intuitive sense.
When energy stocks are ripping relative to long bonds, the market is usually rewarding hard assets, inflationary cash flows, and real-economy exposure while punishing duration.
At the beginning of 2026, XLE finally broke out relative to TLT, and now yields are playing catch-up.
That appears to be unfolding in real time, on Powell’s final day as chairman of the Federal Reserve.
And that brings us back to one of our core views: buying energy stocks remains one of our favorite ways to express a bearish thesis on bonds.
That might sound strange at first, but it makes perfect sense when you think through the mechanics.
If yields are breaking higher as inflationary pressure builds, real assets are outperforming, and capital is rotating away from duration and toward hard-asset cash flows, then energy stocks should be among the primary beneficiaries.
And right now, energy stocks look fantastic.
Yesterday, we went LIVE with our good friend Josh Young, one of the best fundamental energy analysts out there.
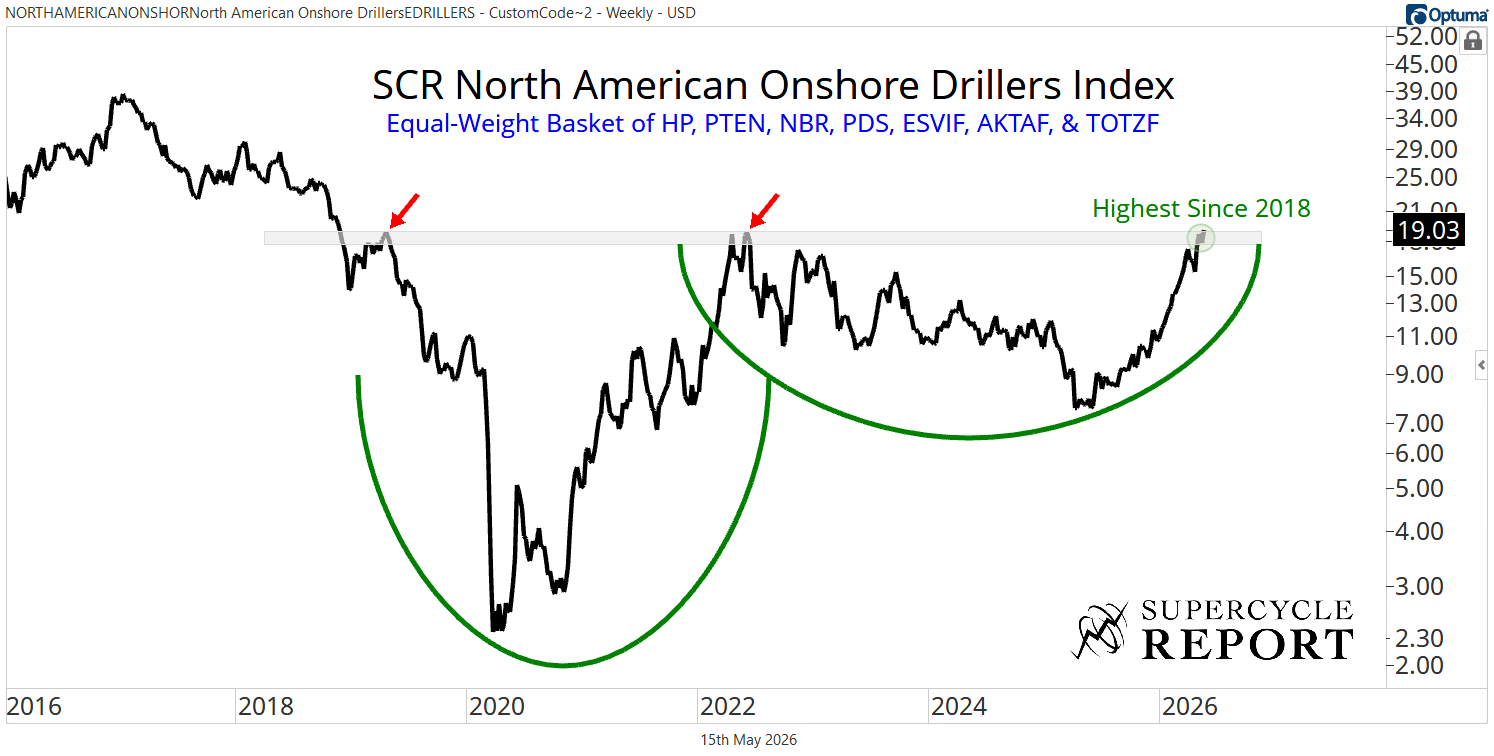
Josh has been pounding the table on a very specific corner of the energy market: North American onshore drillers.
Unfortunately, there isn't an index for the group.
But that's OK... We made our own.
Our Supercycle Report North American Onshore Drillers Index is an equal-weight basket of Helmerich & Payne $HP, Patterson-UTI $PTEN, Nabors $NBR, Precision Drilling $PDS, Ensign Energy Services $ESVIF, AKITA Drilling $AKTAF, and Total Energy Services $TOTZF.
The result is one of the strongest charts in the entire energy space.
After peaking years ago and going through a prolonged bear phase, price carved out a massive base, rallied 700% off the 2020 lows, and then spent the past several years building another basing pattern.
That kind of structure is exactly what we want to see when a cyclical group is transitioning into a new primary uptrend.
And that new primary uptrend is beginning right now as the index closed this week at its highest level since 2018.
From here, this index has tremendous upside potential and very well-defined risk.
We also love how fundamentals and technicals have lined up.
Josh likes the group for fundamental reasons, and we like the group because the chart is breaking out of a massive base.
When both disciplines point in the same direction, the odds of a massive payout increase dramatically.