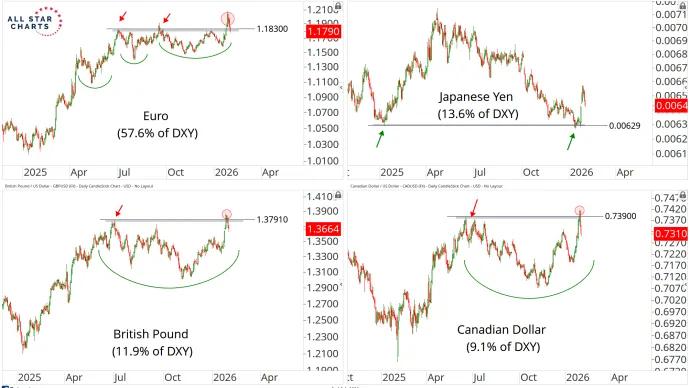
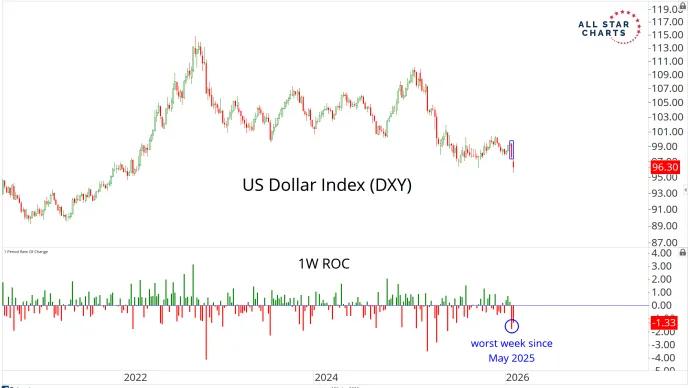
When a structural trend reaches a turning point… expect volatility. We’re a month into 2026, and the US Dollar is already stirring the pot– making big moves and flirting with the completion of a major top.
The yield curve warned us. CRB compressed. XLE broke out.
For months, the yield curve has been doing what it always does before big commodity and energy moves: it started whispering before price started screaming.
This wasn’t a headline trade.This wasn’t a CPI print trade.This was a...
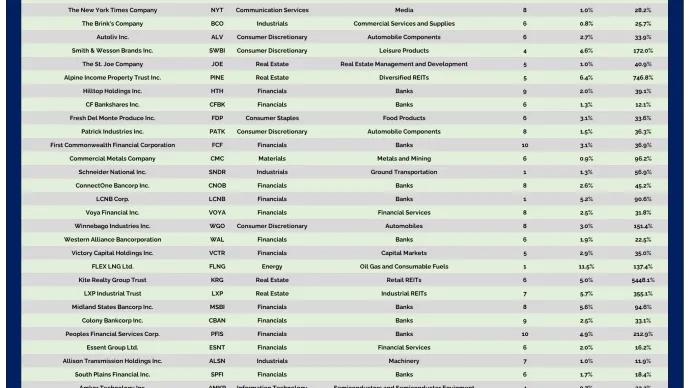
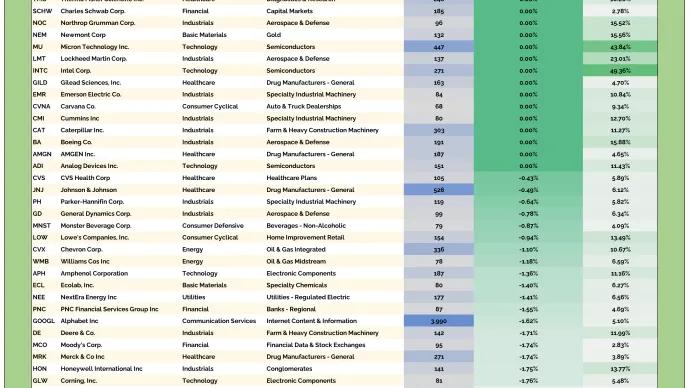
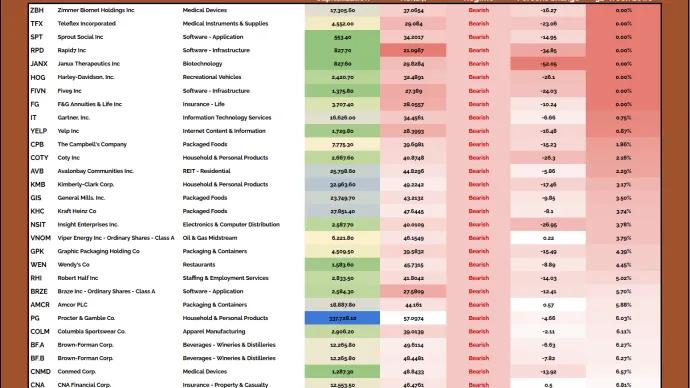
Dividend Aristocrats are easily some of the most desirable investments on Wall Street. These are the names that have increased dividends for at least 25 years, providing steadily...
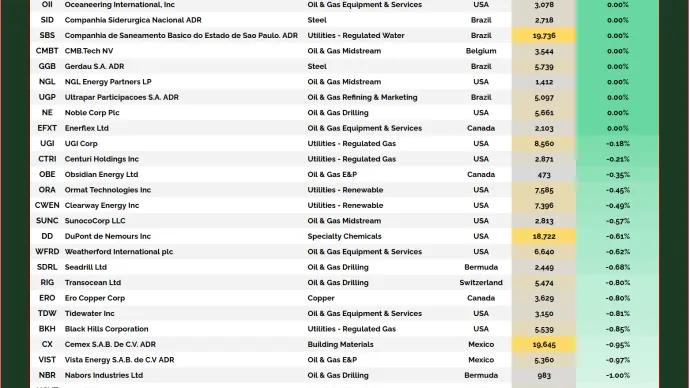
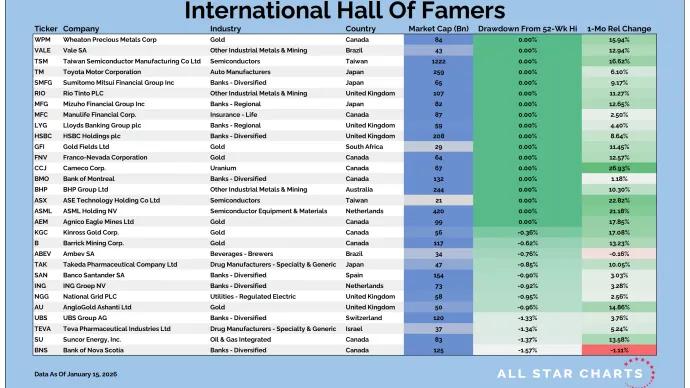
Most natural resource stocks, even the bellwethers of Metals or Energy, for example, can’t scale to $3 Trillion in market cap. They’re simply not built like the juggernauts of tech or communications.
Most natural resource stocks, even the bellwethers of Metals or Energy, for example, can’t scale to $3 Trillion in market cap. They’re simply not built like the juggernauts of tech or communications.