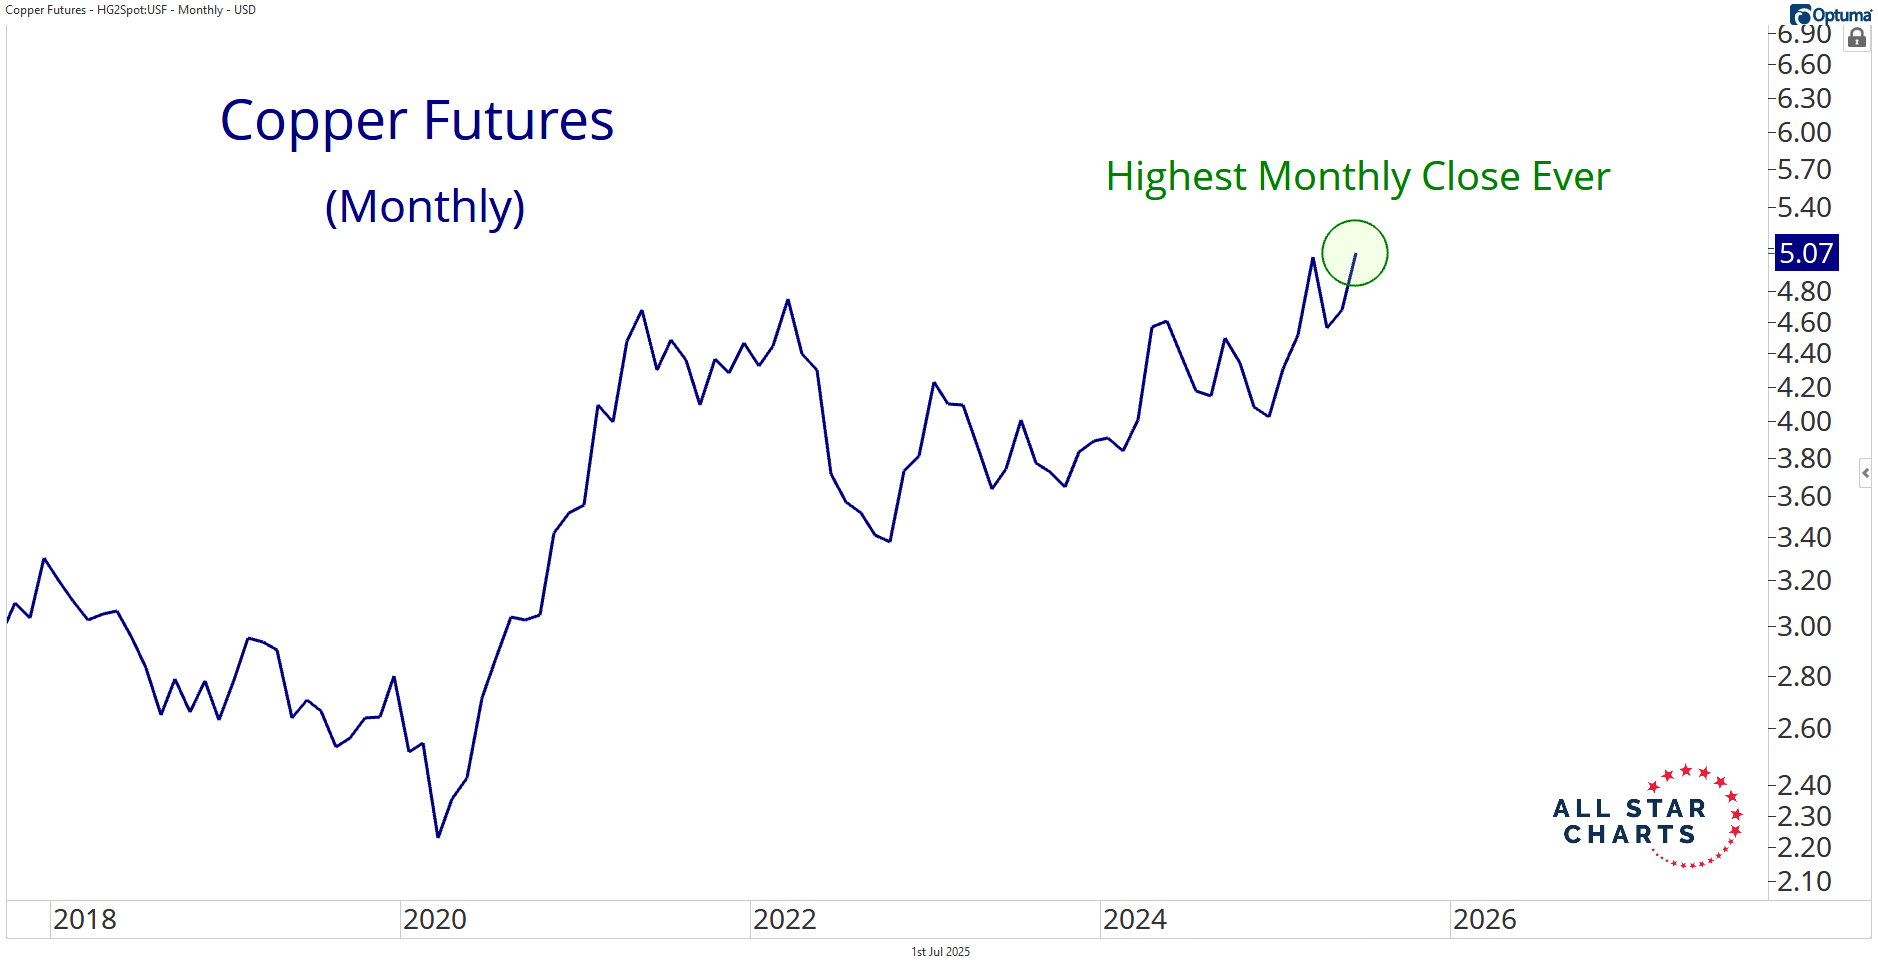
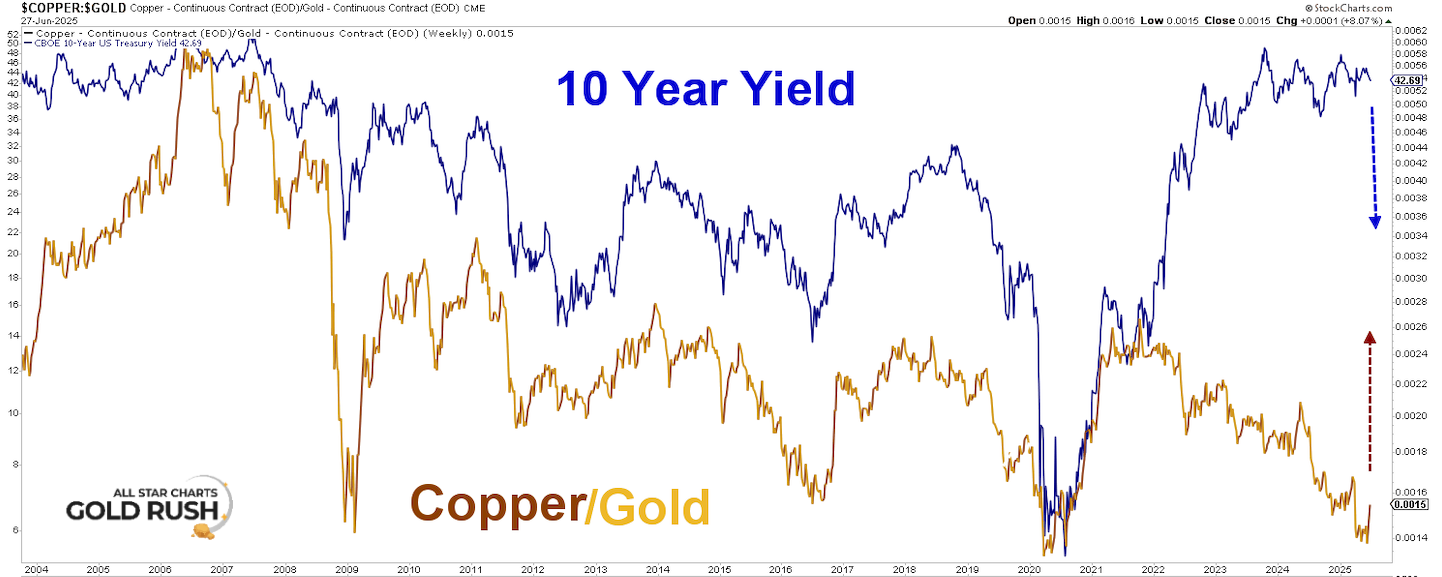
Members Only This Chart Just Changed Everything By Jason Perz July 1, 2025 Copper just made history.The price closed June with its highest monthly close ever.We have the data: Copper futures are printing fresh all-time highs after resolving a prolonged accumulation pattern.And when copper moves, it isn’t just about metals—it’s about yields, growth, and what comes next.Next up is a chart of the Copper/Gold ratio versus the 10-year yield. Forget the recent noise, for decades, long-term yields have followed the Copper/Gold ratio. When Dr. Copper outperforms, yields rise. Every time.Why? Because copper is associated with construction, production, and demand. It’s the heartbeat of the real global economy. Gold is fear. Copper is action.When Copper leads, the market’s not bracing for collapse. Instead, it’s pricing in growth.This is one of the biggest divergences we've ever seen: In recent years, the Copper/Gold ratio and the 10Y yield have carved out one of the largest divergences in history.And now we're seeing early signals that the ratio is going to reverse higher. What happens if it breaks higher from here? Yields are going with it.Not because of rate hikes. Because of real demand.Now ask yourself: What happens if the Fed cuts rates while copper is breaking out and China is ramping back up?We'll get a firestorm in commodities.You think 2020–2021 was hot? That was driven by stimulus and broken supply chains. This bull market is being driven by demand picking up globally and a falling dollar stoking the fire.Hemingway once said, “How did you go bankrupt? Two ways. Gradually, then suddenly.”That’s how breakouts happen, too.And copper just went suddenly. You need to have a subscription to access this content in full. Log in or subscribe today to unlock new features and receive Member Benefits. Log in or Subscribe Supercycle Report Service Menu Service (All Star Charts Gold Rush) Supercycle Portfolio Weekly Members Videos Members Only Articles Special Reports Free Newsletter Contact More from Supercycle Report Sam Gatlin Jason Perz Adding Lithium Exposure Today, we're buying a small-cap lithium mining stock that's breaking out with authority. April 16, 2026 Sam Gatlin Jason Perz The Fuel Behind the Supercycle A weakening dollar, rising global yields, and broadening participation are setting the stage for the next leg higher. April 13, 2026 Sam Gatlin Jason Perz The Next Rotation Is Already Underway As traditional energy cools off, wind energy is flirting with a massive base breakout. April 10, 2026 More from Supercycle Report Supercycle Stocks Live Watch Now Supercycle Stocks Subscribe
Sam Gatlin Jason Perz Adding Lithium Exposure Today, we're buying a small-cap lithium mining stock that's breaking out with authority. April 16, 2026
Sam Gatlin Jason Perz The Fuel Behind the Supercycle A weakening dollar, rising global yields, and broadening participation are setting the stage for the next leg higher. April 13, 2026
Sam Gatlin Jason Perz The Next Rotation Is Already Underway As traditional energy cools off, wind energy is flirting with a massive base breakout. April 10, 2026