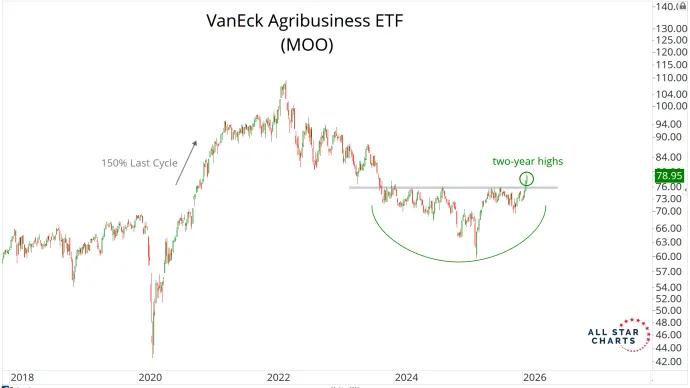
The stock market is on fire and everyone is making money.
But are we making enough money, considering just how good things have been?
Let me rewind for a second. Do you remember all the promises about a recession that was definitely coming? The yield curve. The money printing. Trump is literally Hitler???
We were even told that we would get a credit crisis of some kind. Maybe even another black Monday...
But all we got instead was one of the greatest years for the stock market in American history.
Here's a chart from our pals over at Goldman Sachs showing this year's performance compared to all the other years over the past century.
It's hard to find a better year for investors:
And this is a good lesson for all of us, myself included.
Even though we've been pounding the table this entire bull market to buy stocks and be as aggressive as possible, it's a nice reminder that we should absolutely focus on price behavior, particularly when sentiment is this far removed from reality.
While stocks have been putting up historic returns, the gloom...
For example, your bear market strategies are probably not going to be great during a bull market. Your trend following strategies are probably not going to work too well in rangebound markets. Your...
In today's Flow Show, I flew solo. But have no fear, I have a great idea to work with that was brought to me by the All Star Options community and endorsed by the analysts here at All Star Charts.
You can watch the full episode here:
Earlier in the day, Steve and I were together on a live twitter/X spaces and we were talking about the strength we're seeing in the payments space. Not just the Visas and Mastercards, but the Paypals, Venmos, and Squares.
Universally, we liked the $SQ chart. And my ASO community likes it too.
So here's the weekly $SQ chart that I shared in the show:
There's a lot of room for price action to go to retrace to all-time highs. But we don't need it to get there to earn a nice profit. If we only get halfway there, we can still win big.
Here's the Play:
I like buying $SQ June 125 calls for an approximately $4.50 net debit. With options volatility relatively cheap in this name, these calls are rather affordable in volatility terms.
During the show, I considered possibly selling some nearer-term calls against this position to lower my cost basis, but I've since decided...
A funny thing happened after Donald Trump won the U.S. Election by a landslide....
Everyone just assumed it would be bad for Solar stocks.
And it was, for a moment anyway...
But when everyone just assumes a specific outcome, and everyone is already positioned for that, we love to take the other side as that positioning unwinds.
Remember, it's not the fundamentals that drive asset prices. It's positioning, and the unwinds in extreme positioning that moves asset prices the most violently.
The latest example of this market anomaly is in Solar. Notice how during this sell-off, Momentum never reached oversold conditions.
Oversold conditions are characteristics of downtrends.
Momentum is suggesting that Solar is NOT in one of those...
And when you look at the largest component of the Solar Index, the set up is so clean.
$FSLR has retraced slightly more than 61.8% of the entire rally this year...
If First Solar can recover here and get back into the 200s, then the squeeze is on.
And when you have a setup like this, the goal is to make as much money as possible.
*BREAKING NEWS* $BTC printing fresh all-time highs priced in every fiat currency is NOT bearish for gold.
We recently recorded a video with our in-house crypto analyst, Louis Sykes, to discuss the connections between bitcoin and gold.
The relationship isn't perfect, but it would be irresponsible of us as investors to ignore the correlation between 2 of the most significant hard-money assets in the world.
Welcome back to Under the Hood, where we'll cover all the action for the two weeks ended November 22, 2024. This report is published bi-weekly, in rotation with The Minor Leaguers.
What we do here is analyze the most popular stocks during the week and find opportunities to either join in and ride these momentum names higher, or fade the crowd and bet against them.
We use a variety of sources to generate the list of most popular names.
There are so many new data sources available that all we need to do is organize and curate them in a way that shows us exactly what we want: a list of stocks that are seeing an unusual increase in investor interest.
Click here for a behind-the-scenes look at our process.
Whether we’re measuring increasing interest based on large institutional purchases, unusual options activity, or simply our proprietary lists of trending tickers, there...
The price of $FXI is going in the wrong direction. And as we know, only price pays. Price is truth.
Due to two previous "covered call" premium sales against our long January 2026 35-strike calls and more than one year until our long calls expire, I'm going to get creative with our position to keep the dream alive. I think we can afford to be patient.
I'm confident in doing so because ending the campaign here would only result in a small loss. So there's no panic.
Here's a visual of where we are now:
The purple circle is where I purchased both my long January 2026 calls and sold Dec 35 calls against it. The green circle shows where I rolled my Dec 35 calls to Feb 35 calls for a credit. At the moment, my net cost (max risk) for these Jan 2026 $35 calls is $2.05. This is derived by subtracting the credits for the two short call sales from the cost of the long calls.
I've still got a lot of time until January 2026, and while the chart of FXI is currently disagreeing with me, I can make time my friend. Time heals all wounds, right? We'll see.