“These are the times that try men’s souls. The summer soldier and the sunshine patriot will, in this crisis, shrink from the service of their country…”— Thomas Paine, 1776
It’s one of my favorite lines in all of literature — and one of...
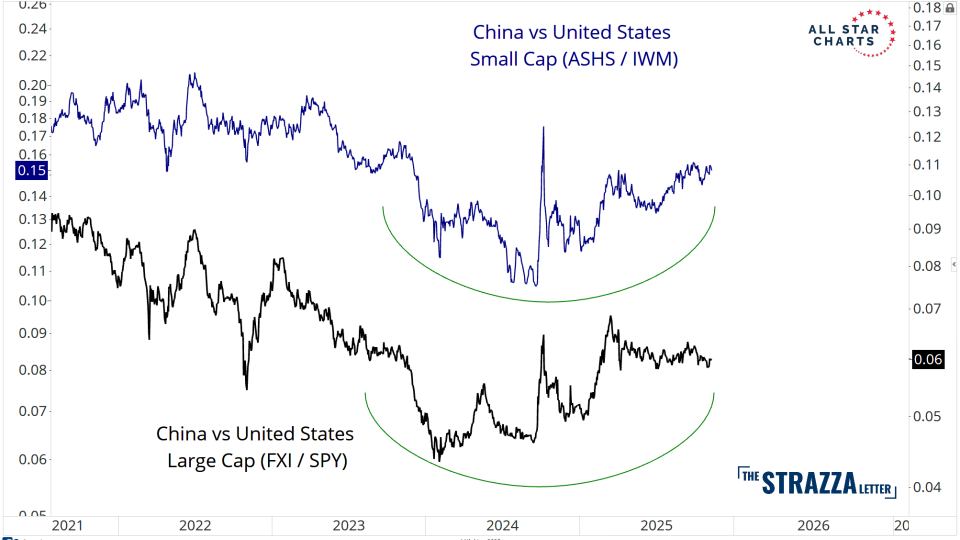
If you pay too much attention to the headlines, you’re probably thinking China is uninvestable.Every week it’s the same story — tariffs, trade tensions, and skepticism around Beijing’s economic data.
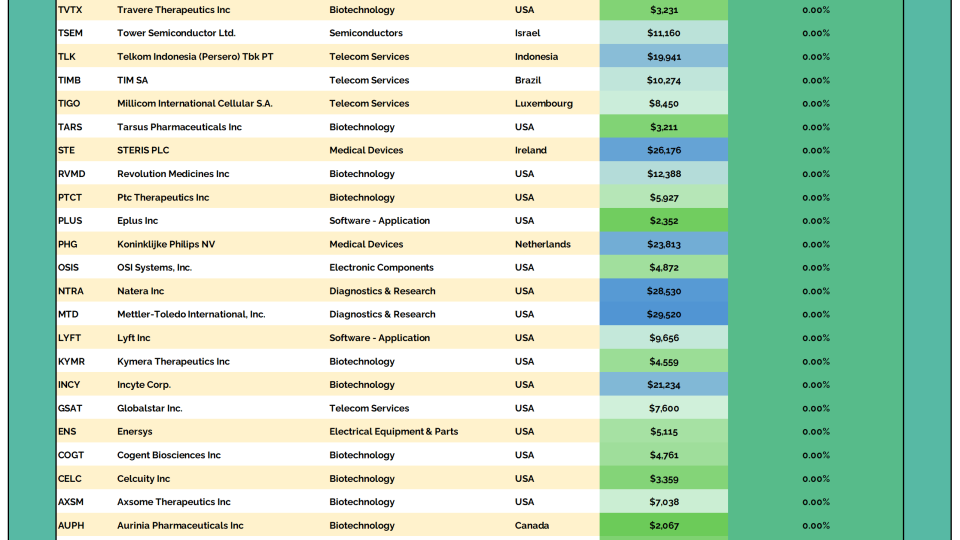
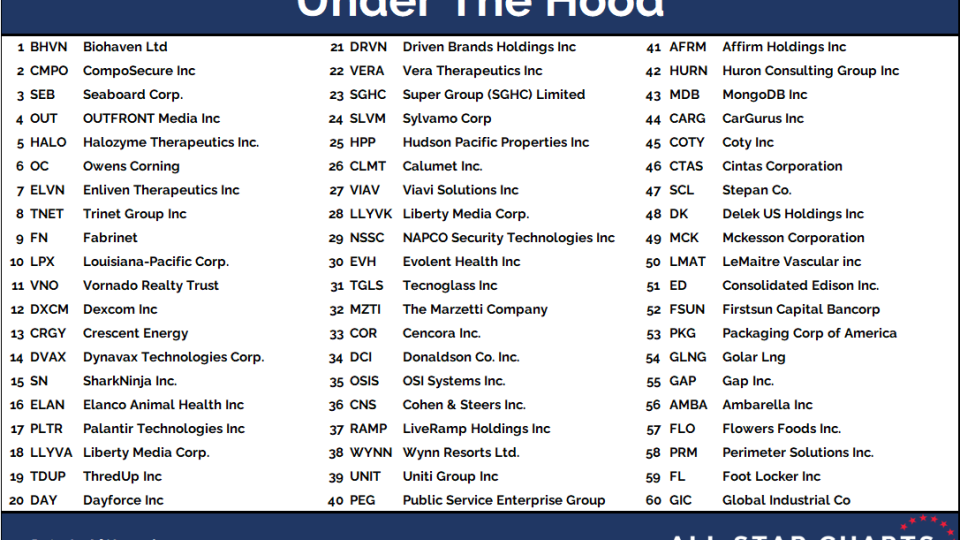
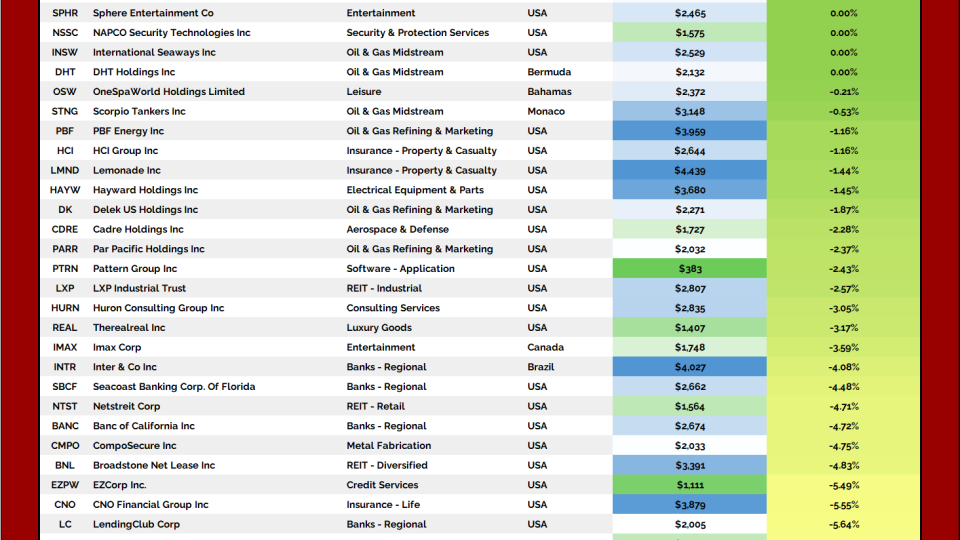
We love our bottoms-up scans here at All Star Charts. We tend to get really creative when making new universes as we want to be sure they will deliver us the best opportunities the market has to...
Most natural resource stocks, even the bellwethers of Metals or Energy, for example, can’t scale to $3 Trillion in market cap. They’re not those types of companies - they’re just not built like the...
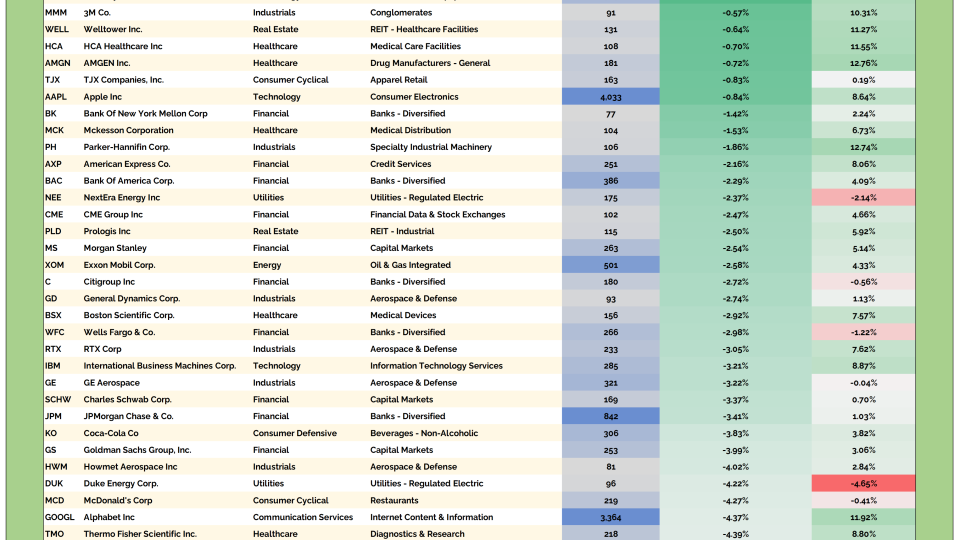
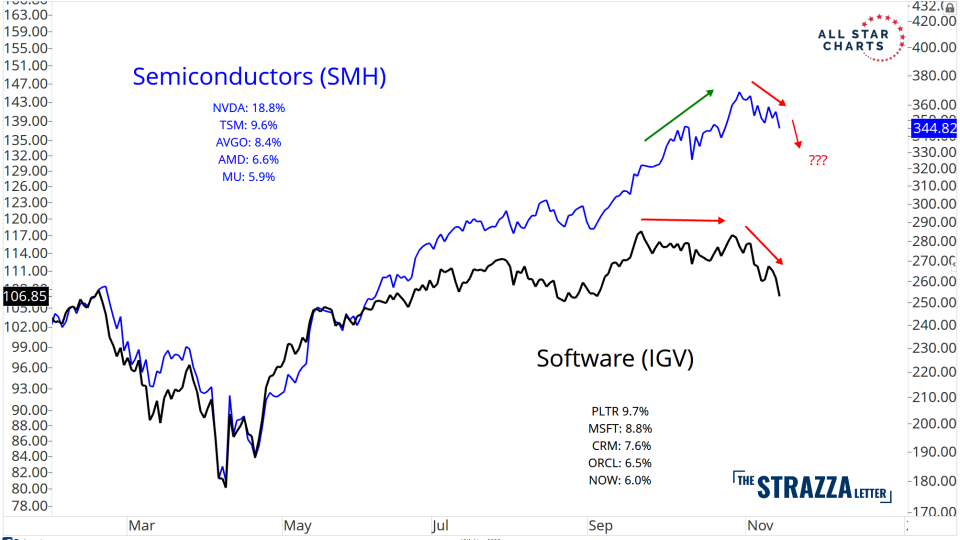
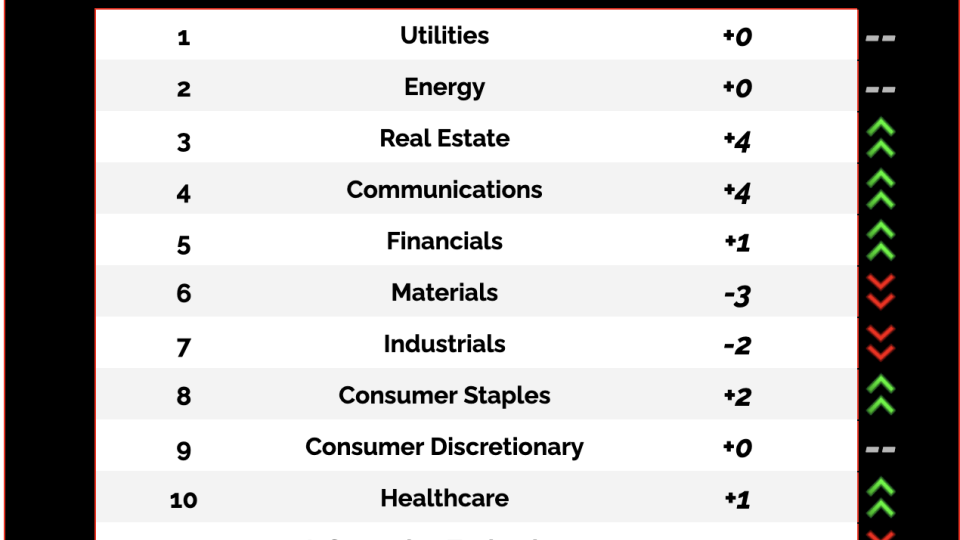
After a month marked by failed breakouts in the riskiest stocks, this morning on the Open Bar, I took a step back and reviewed some of the most bearish groups.