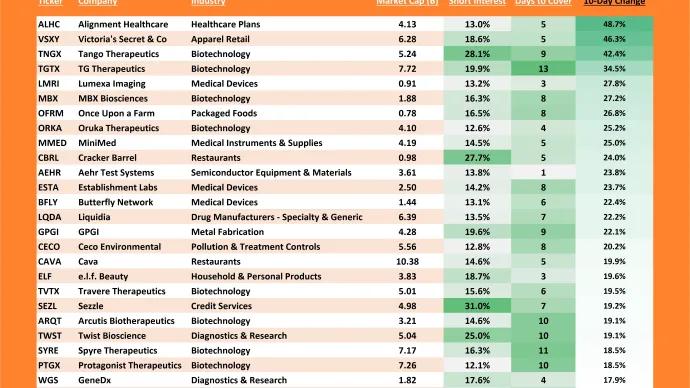
Sam Gatlin The Shorts Are Trapped Again Risk appetite is ripping, and the market’s most crowded bearish bets are starting to go vertical. June 16, 2026 All Star Charts Premium Members Only
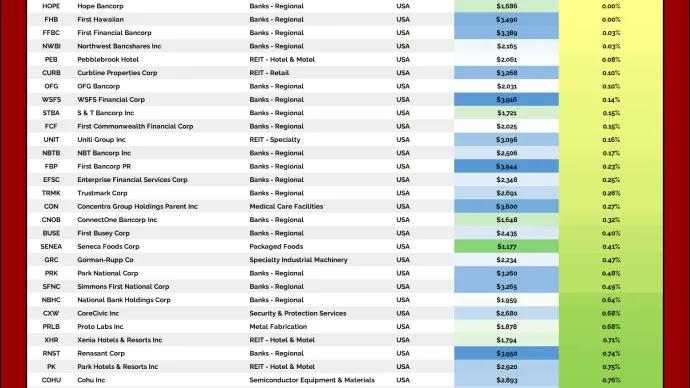
Steve Strazza Top Down Trade of the Week The best bank stocks are overseas June 13, 2026 All Star Charts Premium The Strazza Letter Members Only
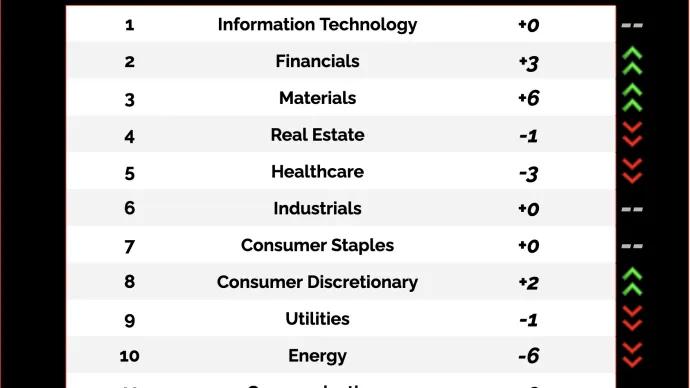
Saturday Morning Chartoons: SpaceX IPO Hits Markets June 13, 2026 All Star Charts Premium Members Only