There's more to the stock market than Semiconductors.
Hello again, Spirit Animals.
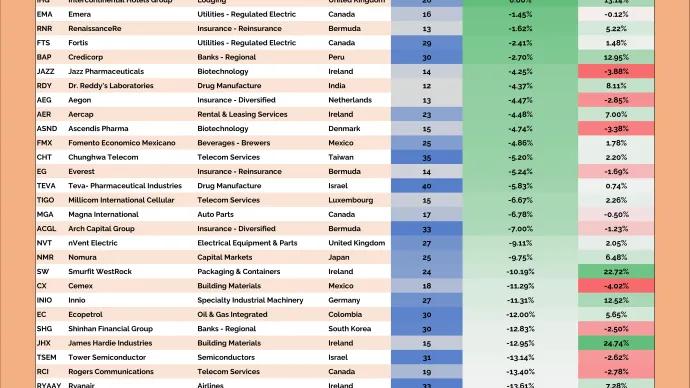
As I surf around the stock market looking at charts, I can't help but notice that new 52-week and All-Time highs are popping in all kinds of sectors. This is breadth. And it's what is healthy for the long-term...
Markets have been choppy. Leadership has rotated. Breakouts have failed. Trends have stalled. Some positions have worked. Others have been stopped out.
Carnival’s recovery story is still alive, but it's still stuck below resistance.
Carnival $CCL is one of the great reopening stories of the past few years.
The company nearly died during COVID, survived one of the ugliest balance sheet events in modern travel history, and then spent the next several years repairing the...