Washington isn’t leaving this one to the free market.
When it comes to the metals that power the clean energy transition and AI - lithium, nickel, cobalt, and rare earths - governments around the world have decided these resources are...
In this week’s Gold Rush video, we covered a lot of ground.
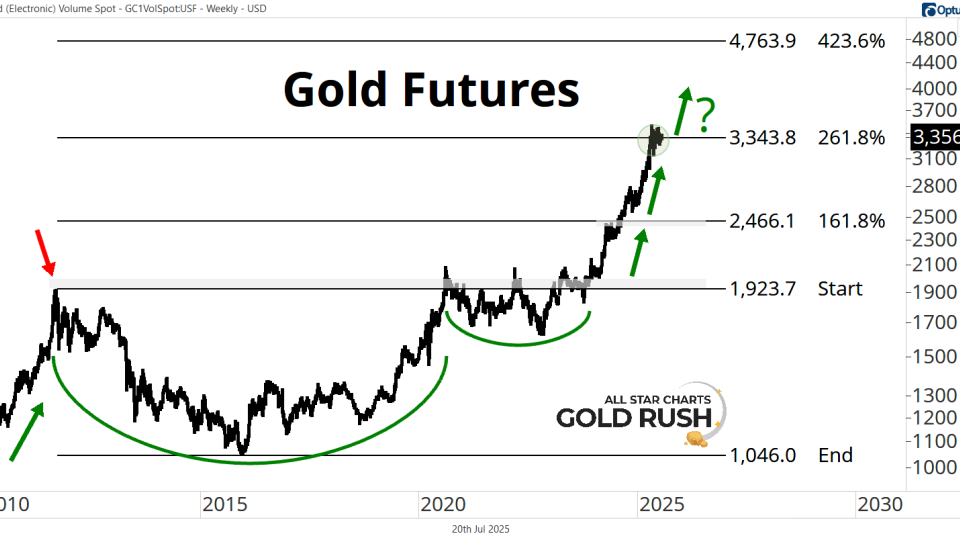
We discussed wild moves in Cattle futures, the energy complex, shifting global bond yields and their impact on the macro landscape, and Gold futures surging to...
Every week, we break down the Commitment of Traders (COT) Report to see how commercial hedgers - the so-called “smart money” in the futures markets - are positioning across asset classes.