The biggest weekly rally since 2020 confirms a powerful shift in the primary trend.
Over the past several weeks in Commodities Weekly, we’ve been laying out a very clear thesis: energy is in the early stages of a major leadership cycle.
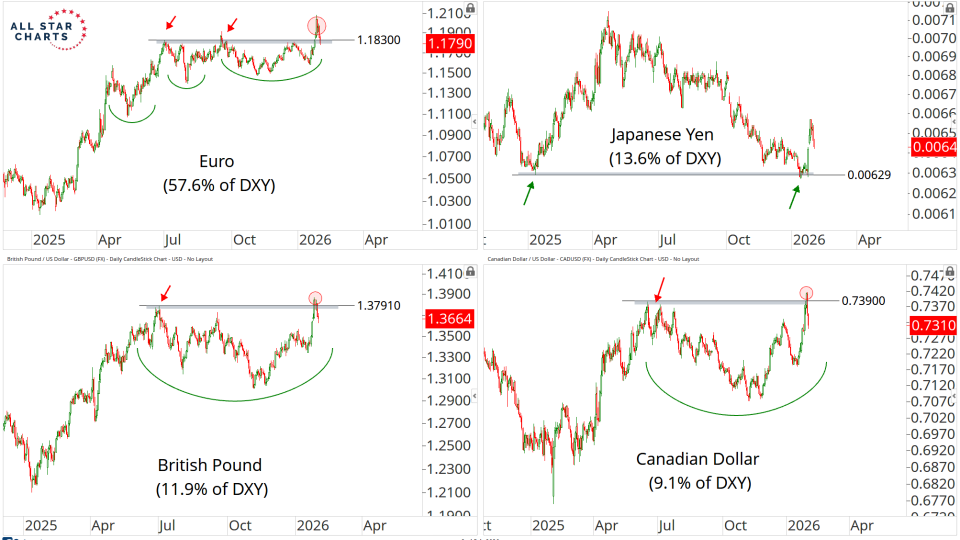
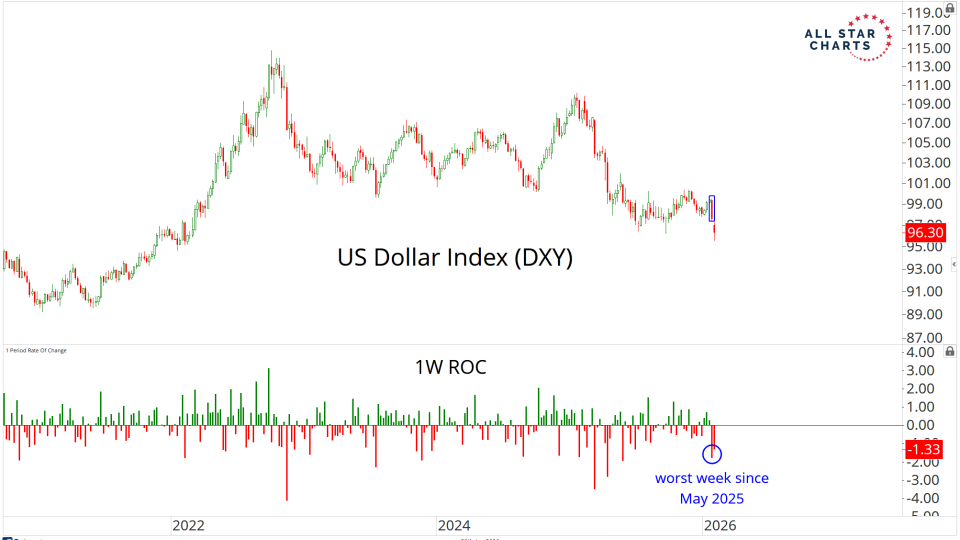
The US Dollar Index $DXY has been locked in a messy range for over a year, wobbling just enough to make everyone second-guess themselves, trapping bears on breakdown attempts and bulls on squeeze attempts.
Most natural resource stocks, even the bellwethers of Metals or Energy, for example, can’t scale to $3 Trillion in market cap. They’re simply not built like the juggernauts of tech or communications.
Gold and Silver are gunning for new all-time highs.
Over the past few weeks, we’ve spent a lot of time talking about just how extended this precious metals trend has become and why it would make sense for the market to pause at any moment.
After all, going into late January, Gold, Silver,...
Most natural resource stocks, even the bellwethers of Metals or Energy, for example, can’t scale to $3 Trillion in market cap. They’re simply not built like the juggernauts of tech or communications.
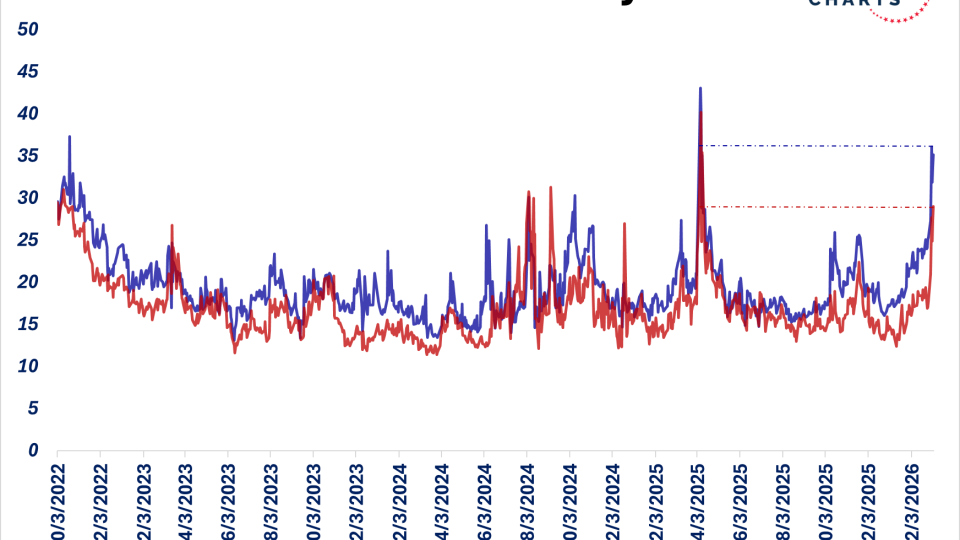
When a structural trend reaches a turning point… expect volatility. We’re a month into 2026, and the US Dollar is already stirring the pot– making big moves and flirting with the completion of a major top.
The yield curve warned us. CRB compressed. XLE broke out.
For months, the yield curve has been doing what it always does before big commodity and energy moves: it started whispering before price started screaming.
This wasn’t a headline trade.This wasn’t a CPI print trade.This was a...
Most natural resource stocks, even the bellwethers of Metals or Energy, for example, can’t scale to $3 Trillion in market cap. They’re simply not built like the juggernauts of tech or communications.